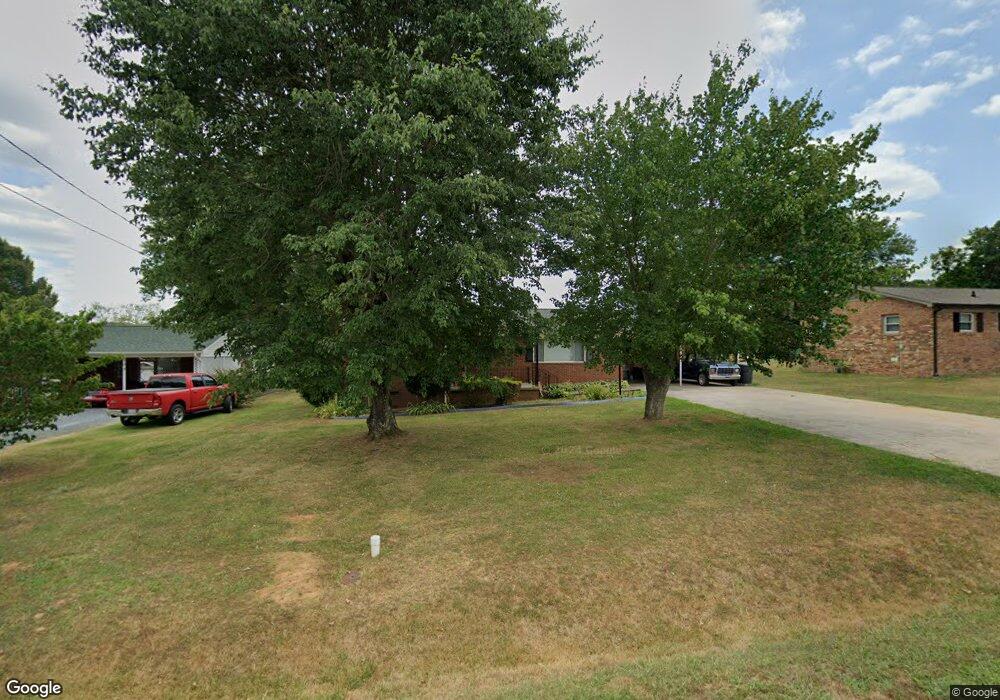
513 Jordan Ave Asheboro, NC 27203
Estimated Value: $207,000 - $256,000
--
Bed
2
Baths
1,489
Sq Ft
$156/Sq Ft
Est. Value
About This Home
This home is located at 513 Jordan Ave, Asheboro, NC 27203 and is currently estimated at $232,560, approximately $156 per square foot. 513 Jordan Ave is a home located in Randolph County with nearby schools including Balfour Elementary School, North Asheboro Middle School, and Asheboro High School.
Ownership History
Date
Name
Owned For
Owner Type
Purchase Details
Closed on
Jul 30, 2008
Sold by
Warren Rickey J and Warren Deborah L
Bought by
Vasquez Santiago and Vasquez Maria F
Current Estimated Value
Home Financials for this Owner
Home Financials are based on the most recent Mortgage that was taken out on this home.
Original Mortgage
$106,904
Outstanding Balance
$70,008
Interest Rate
6.37%
Mortgage Type
FHA
Estimated Equity
$162,552
Purchase Details
Closed on
May 6, 1993
Bought by
Vasquez Santiago Jr Vasquez Maria
Create a Home Valuation Report for This Property
The Home Valuation Report is an in-depth analysis detailing your home's value as well as a comparison with similar homes in the area
Home Values in the Area
Average Home Value in this Area
Purchase History
| Date | Buyer | Sale Price | Title Company |
|---|---|---|---|
| Vasquez Santiago | $108,000 | None Available | |
| Vasquez Santiago Jr Vasquez Maria | $72,500 | -- |
Source: Public Records
Mortgage History
| Date | Status | Borrower | Loan Amount |
|---|---|---|---|
| Open | Vasquez Santiago | $106,904 |
Source: Public Records
Tax History Compared to Growth
Tax History
| Year | Tax Paid | Tax Assessment Tax Assessment Total Assessment is a certain percentage of the fair market value that is determined by local assessors to be the total taxable value of land and additions on the property. | Land | Improvement |
|---|---|---|---|---|
| 2025 | $2,113 | $159,400 | $28,400 | $131,000 |
| 2024 | $2,113 | $159,400 | $28,400 | $131,000 |
| 2023 | $2,113 | $159,400 | $28,400 | $131,000 |
| 2022 | $1,688 | $117,090 | $24,730 | $92,360 |
| 2021 | $1,688 | $117,090 | $24,730 | $92,360 |
| 2020 | $1,688 | $117,090 | $24,730 | $92,360 |
| 2019 | $1,688 | $117,090 | $24,730 | $92,360 |
| 2018 | $1,418 | $96,600 | $20,490 | $76,110 |
| 2016 | $1,418 | $96,603 | $20,490 | $76,113 |
| 2015 | $1,420 | $96,603 | $20,490 | $76,113 |
| 2014 | -- | $96,603 | $20,490 | $76,113 |
Source: Public Records
Map
Nearby Homes
- 1847 Saddlewood Ct
- 1807 Newell St
- 1822 Newell St
- 223 Mclaurin Dr
- 0 English St
- 410 Millikan Dr
- 2004 Northmont Dr
- 222 Cracklin Dr
- 405 Saunders Dr
- 1537 Humble St
- 728 Central Falls Rd
- 734 Central Falls Rd
- 503 Sunrise Ave
- 738 Oak Bend Dr
- 1684 Pen Oak Dr
- 2193 Berkley Ln
- 1907 Levance St
- 1913 Levance St
- 2589 Northmont Lake Dr
- 911 Old Liberty Rd