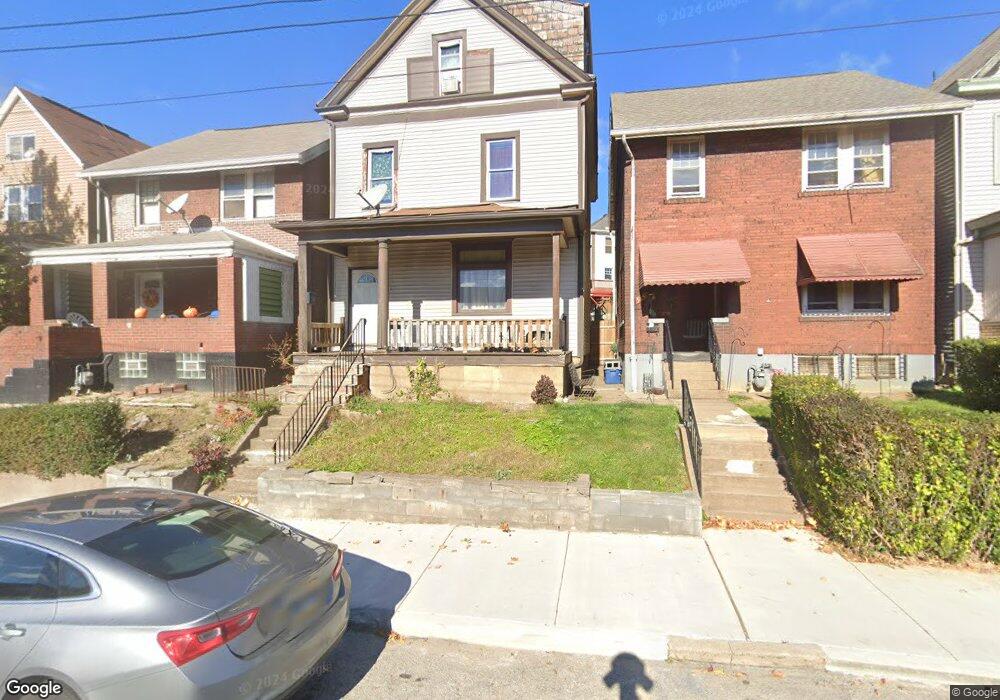
513 Maple St East Pittsburgh, PA 15112
Estimated Value: $56,000 - $107,000
5
Beds
1
Bath
1,425
Sq Ft
$57/Sq Ft
Est. Value
About This Home
This home is located at 513 Maple St, East Pittsburgh, PA 15112 and is currently estimated at $80,513, approximately $56 per square foot. 513 Maple St is a home located in Allegheny County with nearby schools including Woodland Hills Senior High School, Braddock Hills High School, and Propel Cs-East.
Ownership History
Date
Name
Owned For
Owner Type
Purchase Details
Closed on
Jul 10, 2003
Sold by
The 56 We Buy Houses
Bought by
Miller Gregory
Current Estimated Value
Home Financials for this Owner
Home Financials are based on the most recent Mortgage that was taken out on this home.
Original Mortgage
$45,000
Outstanding Balance
$19,405
Interest Rate
5.45%
Mortgage Type
New Conventional
Estimated Equity
$61,108
Purchase Details
Closed on
Jan 16, 1999
Sold by
Burik Jean Stark
Bought by
The 56 We Buy Houses Ltd Partnership
Purchase Details
Closed on
Jan 1, 1900
Create a Home Valuation Report for This Property
The Home Valuation Report is an in-depth analysis detailing your home's value as well as a comparison with similar homes in the area
Home Values in the Area
Average Home Value in this Area
Purchase History
| Date | Buyer | Sale Price | Title Company |
|---|---|---|---|
| Miller Gregory | $40,000 | -- | |
| The 56 We Buy Houses Ltd Partnership | $12,000 | -- | |
| -- | -- | -- |
Source: Public Records
Mortgage History
| Date | Status | Borrower | Loan Amount |
|---|---|---|---|
| Open | Miller Gregory | $45,000 |
Source: Public Records
Tax History Compared to Growth
Tax History
| Year | Tax Paid | Tax Assessment Tax Assessment Total Assessment is a certain percentage of the fair market value that is determined by local assessors to be the total taxable value of land and additions on the property. | Land | Improvement |
|---|---|---|---|---|
| 2025 | $626 | $14,000 | $3,000 | $11,000 |
| 2024 | $626 | $14,000 | $3,000 | $11,000 |
| 2023 | $632 | $14,000 | $3,000 | $11,000 |
| 2022 | $632 | $14,000 | $3,000 | $11,000 |
| 2021 | $66 | $14,000 | $3,000 | $11,000 |
| 2020 | $620 | $14,000 | $3,000 | $11,000 |
| 2019 | $609 | $14,000 | $3,000 | $11,000 |
| 2018 | $66 | $14,000 | $3,000 | $11,000 |
| 2017 | $609 | $14,000 | $3,000 | $11,000 |
| 2016 | $66 | $14,000 | $3,000 | $11,000 |
| 2015 | $66 | $14,000 | $3,000 | $11,000 |
| 2014 | $571 | $28,200 | $3,000 | $25,200 |
Source: Public Records
Map
Nearby Homes