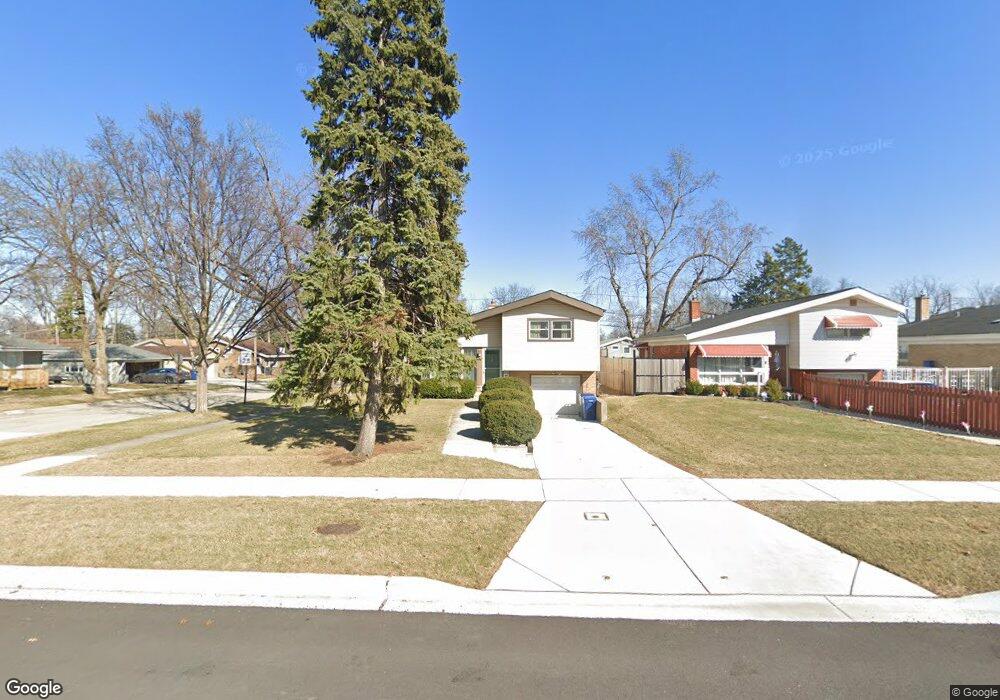
513 N Iowa Ave Villa Park, IL 60181
Estimated Value: $276,000 - $348,000
3
Beds
--
Bath
1,036
Sq Ft
$296/Sq Ft
Est. Value
About This Home
This home is located at 513 N Iowa Ave, Villa Park, IL 60181 and is currently estimated at $306,772, approximately $296 per square foot. 513 N Iowa Ave is a home located in DuPage County with nearby schools including North Elementary School, Jefferson Middle School, and Willowbrook High School.
Ownership History
Date
Name
Owned For
Owner Type
Purchase Details
Closed on
Nov 29, 2006
Sold by
Heneghan Cynthia Steben
Bought by
Rickert Joshua and Rickert Mary
Current Estimated Value
Home Financials for this Owner
Home Financials are based on the most recent Mortgage that was taken out on this home.
Original Mortgage
$200,000
Outstanding Balance
$120,830
Interest Rate
6.5%
Mortgage Type
Purchase Money Mortgage
Estimated Equity
$185,942
Purchase Details
Closed on
Dec 12, 2003
Sold by
Heneghan Thomas M
Bought by
Heneghan Cynthia Steben and Heneghan Cynthia S
Home Financials for this Owner
Home Financials are based on the most recent Mortgage that was taken out on this home.
Original Mortgage
$126,000
Interest Rate
4.5%
Mortgage Type
New Conventional
Purchase Details
Closed on
Sep 26, 2002
Sold by
Heneghan Cynthia Steben
Bought by
Heneghan Thomas M and Heneghan Cynthia Steben
Home Financials for this Owner
Home Financials are based on the most recent Mortgage that was taken out on this home.
Original Mortgage
$101,300
Interest Rate
6.34%
Create a Home Valuation Report for This Property
The Home Valuation Report is an in-depth analysis detailing your home's value as well as a comparison with similar homes in the area
Home Values in the Area
Average Home Value in this Area
Purchase History
| Date | Buyer | Sale Price | Title Company |
|---|---|---|---|
| Rickert Joshua | $250,000 | First American Title Ins Co | |
| Heneghan Cynthia Steben | -- | Fidelity National Title Ins | |
| Heneghan Thomas M | -- | Law Title |
Source: Public Records
Mortgage History
| Date | Status | Borrower | Loan Amount |
|---|---|---|---|
| Open | Rickert Joshua | $200,000 | |
| Previous Owner | Heneghan Cynthia Steben | $126,000 | |
| Previous Owner | Heneghan Thomas M | $101,300 |
Source: Public Records
Tax History Compared to Growth
Tax History
| Year | Tax Paid | Tax Assessment Tax Assessment Total Assessment is a certain percentage of the fair market value that is determined by local assessors to be the total taxable value of land and additions on the property. | Land | Improvement |
|---|---|---|---|---|
| 2024 | $5,684 | $83,203 | $10,814 | $72,389 |
| 2023 | $5,398 | $76,940 | $10,000 | $66,940 |
| 2022 | $5,284 | $73,960 | $9,610 | $64,350 |
| 2021 | $5,065 | $72,120 | $9,370 | $62,750 |
| 2020 | $4,941 | $70,530 | $9,160 | $61,370 |
| 2019 | $4,606 | $67,060 | $8,710 | $58,350 |
| 2018 | $4,283 | $59,320 | $7,700 | $51,620 |
| 2017 | $4,172 | $56,530 | $7,340 | $49,190 |
| 2016 | $4,043 | $53,250 | $6,910 | $46,340 |
| 2015 | $3,973 | $49,610 | $6,440 | $43,170 |
| 2014 | $4,067 | $50,820 | $12,380 | $38,440 |
| 2013 | $3,878 | $51,530 | $12,550 | $38,980 |
Source: Public Records
Map
Nearby Homes
- 600 N Iowa Ave
- 526 N Harvard Ave
- 439 N Harvard Ave
- 417 W Terrace St
- 739 N 2nd Ave
- 700 W Pleasant St
- 18W570 W North Ave
- 714 W Pleasant St
- 37 N Addison Rd
- 433 N Lincoln Ave
- 247 N Ardmore Ave
- 490 N Chatham Ave
- 235 N Ardmore Ave
- 434 N Lincoln Ave
- 117 E Vermont St
- 58 E Division St
- 2N152 Wisconsin Ave
- 434 N Highland Ave
- 912 E Saint Charles Rd
- 935 E Saint Charles Rd
- 509 N Iowa Ave
- 505 N Iowa Ave
- Lot 1 N Iowa Ave
- 519 N Iowa Ave
- 512 N Wisconsin Ave
- 501 N Iowa Ave
- 508 N Wisconsin Ave
- 504 N Wisconsin Ave
- 521 N Iowa Ave
- 518 N Wisconsin Ave
- 451 N Iowa Ave
- 512 N Iowa Ave
- 508 N Iowa Ave
- 500 N Wisconsin Ave
- 520 N Wisconsin Ave
- 525 N Iowa Ave
- 504 N Iowa Ave
- 452 N Wisconsin Ave
- 518 N Iowa Ave
- 447 N Iowa Ave