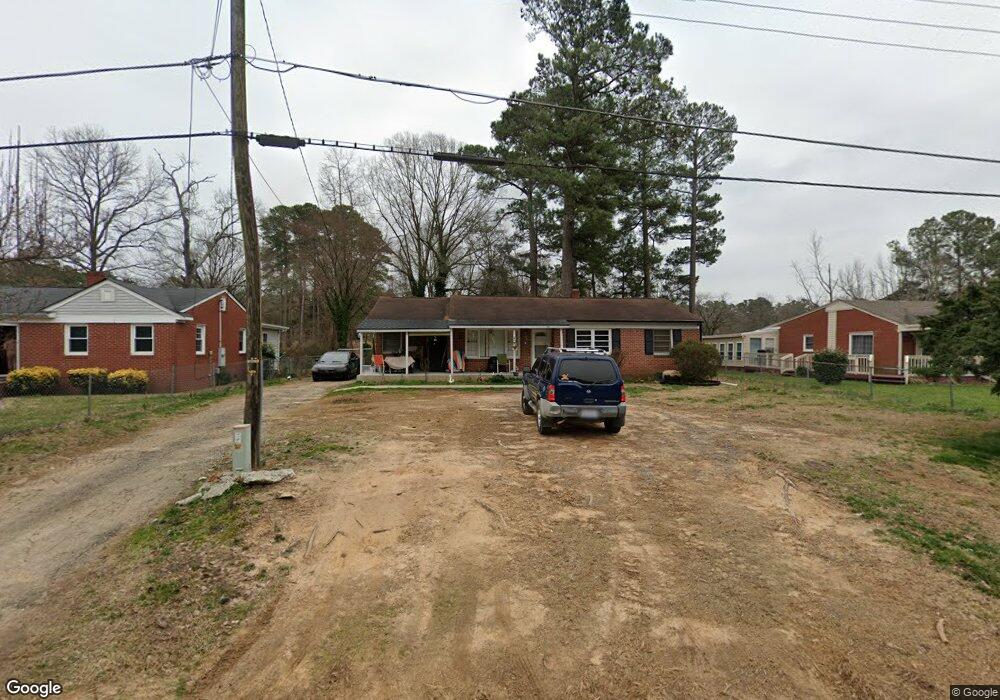
513 W Makepeace St Sanford, NC 27330
Estimated Value: $163,000 - $192,000
3
Beds
2
Baths
1,342
Sq Ft
$131/Sq Ft
Est. Value
About This Home
This home is located at 513 W Makepeace St, Sanford, NC 27330 and is currently estimated at $175,625, approximately $130 per square foot. 513 W Makepeace St is a home located in Lee County with nearby schools including Benjamin T. Bullock Elementary School, West Lee Middle School, and Southern Lee High School.
Ownership History
Date
Name
Owned For
Owner Type
Purchase Details
Closed on
Dec 6, 2005
Sold by
Dena Inc
Bought by
Chavez Dilcia L and Hercules Juan Sanchez
Current Estimated Value
Home Financials for this Owner
Home Financials are based on the most recent Mortgage that was taken out on this home.
Original Mortgage
$68,468
Outstanding Balance
$38,126
Interest Rate
6.21%
Mortgage Type
FHA
Estimated Equity
$137,499
Purchase Details
Closed on
Apr 19, 2004
Sold by
Citifinancial Mortgage Company
Bought by
Dena, Inc
Purchase Details
Closed on
Jan 21, 2004
Sold by
Bruton Wilbert
Bought by
Citifinancial Mortgage Company
Purchase Details
Closed on
Feb 10, 2000
Sold by
Aca/Pja Llc
Bought by
Bruton Wilbert
Purchase Details
Closed on
Jul 28, 1999
Sold by
Duguid James E
Bought by
Aca/Pja Llc
Create a Home Valuation Report for This Property
The Home Valuation Report is an in-depth analysis detailing your home's value as well as a comparison with similar homes in the area
Home Values in the Area
Average Home Value in this Area
Purchase History
| Date | Buyer | Sale Price | Title Company |
|---|---|---|---|
| Chavez Dilcia L | $69,500 | None Available | |
| Dena, Inc | $49,000 | -- | |
| Citifinancial Mortgage Company | $49,000 | -- | |
| Bruton Wilbert | $72,000 | -- | |
| Aca/Pja Llc | $37,000 | -- |
Source: Public Records
Mortgage History
| Date | Status | Borrower | Loan Amount |
|---|---|---|---|
| Open | Chavez Dilcia L | $68,468 |
Source: Public Records
Tax History Compared to Growth
Tax History
| Year | Tax Paid | Tax Assessment Tax Assessment Total Assessment is a certain percentage of the fair market value that is determined by local assessors to be the total taxable value of land and additions on the property. | Land | Improvement |
|---|---|---|---|---|
| 2025 | $1,495 | $94,900 | $13,000 | $81,900 |
| 2024 | $1,475 | $94,900 | $13,000 | $81,900 |
| 2023 | $1,465 | $94,900 | $13,000 | $81,900 |
| 2022 | $1,041 | $53,400 | $4,200 | $49,200 |
| 2021 | $1,047 | $53,400 | $4,200 | $49,200 |
| 2020 | $1,044 | $53,400 | $4,200 | $49,200 |
| 2019 | $1,004 | $53,400 | $4,200 | $49,200 |
| 2018 | $988 | $53,900 | $4,200 | $49,700 |
| 2017 | $977 | $53,900 | $4,200 | $49,700 |
| 2016 | $952 | $53,900 | $4,200 | $49,700 |
| 2014 | $911 | $53,900 | $4,200 | $49,700 |
Source: Public Records
Map
Nearby Homes
- 610 Pineland St
- 1213 Freeman Dr
- 1209 Freeman Dr
- 1205 Freeman Dr
- 1203 Freeman Dr
- 816 W Rose St
- 406 Courtland Dr
- 915 S 3rd St
- 815 Hillwood St
- 1313 Hooker St
- 311 Flourishing St
- 323 Flourishing St
- 242 Faith Ave
- 215 Faith Ave
- 235 Faith Ave
- 234 Faith Ave
- 243 Faith Ave
- 122 Favored Ave
- Beramont Plan at Provisions at Courtland
- Drayton Plan at Provisions at Courtland
- 509 W Makepeace St
- 517 W Makepeace St
- 507 W Makepeace St
- 1009 Hall St
- 521 W Makepeace St
- 505 W Makepeace St
- 514 W Makepeace St
- 512 W Makepeace St
- 516 W Makepeace St
- 508 W Makepeace St
- 1004 Martin St
- 501 W Makepeace St
- 506 W Makepeace St
- 520 W Makepeace St
- 1015 Hall St
- 1002 Hall St
- 510 W Rose St
- 502 W Makepeace St
- 511 Pineland St
- 1004 Hall St