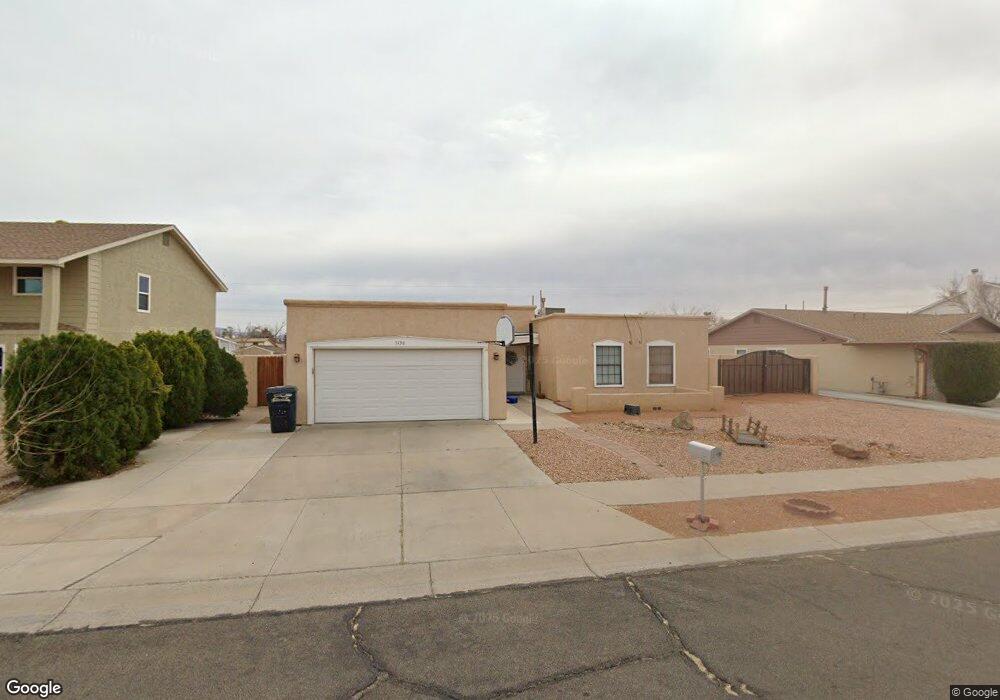
5130 Cordoniz St NW Albuquerque, NM 87120
Taylor Ranch NeighborhoodEstimated Value: $333,000 - $404,000
4
Beds
2
Baths
1,800
Sq Ft
$203/Sq Ft
Est. Value
About This Home
This home is located at 5130 Cordoniz St NW, Albuquerque, NM 87120 and is currently estimated at $365,415, approximately $203 per square foot. 5130 Cordoniz St NW is a home located in Bernalillo County with nearby schools including Chaparral Elementary School, L.B. Johnson Middle School, and Volcano Vista High School.
Ownership History
Date
Name
Owned For
Owner Type
Purchase Details
Closed on
Jul 13, 2018
Sold by
Aldana Michael and Aldana Alexis A
Bought by
Aldana Michelle and Aldana Alexis A
Current Estimated Value
Home Financials for this Owner
Home Financials are based on the most recent Mortgage that was taken out on this home.
Original Mortgage
$164,000
Outstanding Balance
$141,833
Interest Rate
4.5%
Mortgage Type
New Conventional
Estimated Equity
$223,582
Purchase Details
Closed on
May 29, 2002
Sold by
Worley Delores J
Bought by
Aldana Alexis A and Aldana Michelle
Home Financials for this Owner
Home Financials are based on the most recent Mortgage that was taken out on this home.
Original Mortgage
$128,448
Interest Rate
6.92%
Mortgage Type
FHA
Purchase Details
Closed on
Feb 5, 1999
Sold by
Worley Lawrence and Worley Betty J
Bought by
Worley Delores J
Create a Home Valuation Report for This Property
The Home Valuation Report is an in-depth analysis detailing your home's value as well as a comparison with similar homes in the area
Home Values in the Area
Average Home Value in this Area
Purchase History
| Date | Buyer | Sale Price | Title Company |
|---|---|---|---|
| Aldana Michelle | -- | Stewart Title Co | |
| Aldana Alexis A | -- | Stewart Title | |
| Worley Delores J | -- | Fidelity National Title Ins |
Source: Public Records
Mortgage History
| Date | Status | Borrower | Loan Amount |
|---|---|---|---|
| Open | Aldana Michelle | $164,000 | |
| Closed | Aldana Alexis A | $128,448 |
Source: Public Records
Tax History Compared to Growth
Tax History
| Year | Tax Paid | Tax Assessment Tax Assessment Total Assessment is a certain percentage of the fair market value that is determined by local assessors to be the total taxable value of land and additions on the property. | Land | Improvement |
|---|---|---|---|---|
| 2025 | $2,817 | $70,831 | $17,877 | $52,954 |
| 2024 | $2,817 | $68,768 | $17,356 | $51,412 |
| 2023 | $2,768 | $66,765 | $16,851 | $49,914 |
| 2022 | $2,672 | $64,821 | $16,360 | $48,461 |
| 2021 | $2,580 | $62,934 | $15,884 | $47,050 |
| 2020 | $2,535 | $61,100 | $15,421 | $45,679 |
| 2019 | $2,458 | $59,321 | $14,972 | $44,349 |
| 2018 | $2,368 | $59,321 | $14,972 | $44,349 |
| 2017 | $2,293 | $57,594 | $14,536 | $43,058 |
| 2016 | $2,225 | $54,288 | $13,702 | $40,586 |
| 2015 | $52,707 | $52,707 | $13,303 | $39,404 |
| 2014 | $2,088 | $51,173 | $12,916 | $38,257 |
| 2013 | -- | $49,683 | $12,540 | $37,143 |
Source: Public Records
Map
Nearby Homes
- 5143 Gaviota NW
- 5129 Camino Vista NW
- 5101 Tecolote NW
- 5504 Hayes Dr NW
- 5909 Storyteller Rd NW
- 6005 Rio Pueblo Dr NW
- 6304 Flor Del Sol Place NW
- 6133 Flor de Mayo Place NW
- 0 Unser Blvd NW
- 6012 Legends Ave NW
- 6618 Azuelo Ave NW
- 5805 Chimayo Dr NW
- 6615 Astair Ave NW Unit 1
- 0 Canada Vista Place NW
- 5901 Chimayo Dr NW
- 5432 Mariposa Dr NW
- 5609 Cambria Rd NW
- 4844 Stafford Place NW
- 4936 Butte Place NW
- 6705 Lamar Ave NW
- 5126 Cordoniz St NW
- 5900 Gorrion St NW
- 5120 Cordoniz St NW
- 5138 Cordoniz St NW
- 5127 Cordoniz St NW
- 5901 Gorrion St NW
- 5123 Cordoniz St NW
- 5116 Cordoniz St NW
- 5912 Gorrion St NW
- 5142 Cordoniz St NW
- 5905 Gorrion St NW
- 5119 Cordoniz St NW
- 5909 Gorrion St NW
- 5112 Cordoniz St NW
- 5115 Cordoniz St NW
- 6000 Gorrion St NW
- 5915 Gorrion St NW
- 6010 Gorrion St NW
- 6016 Gorrion St NW
- 5146 Cordoniz St NW