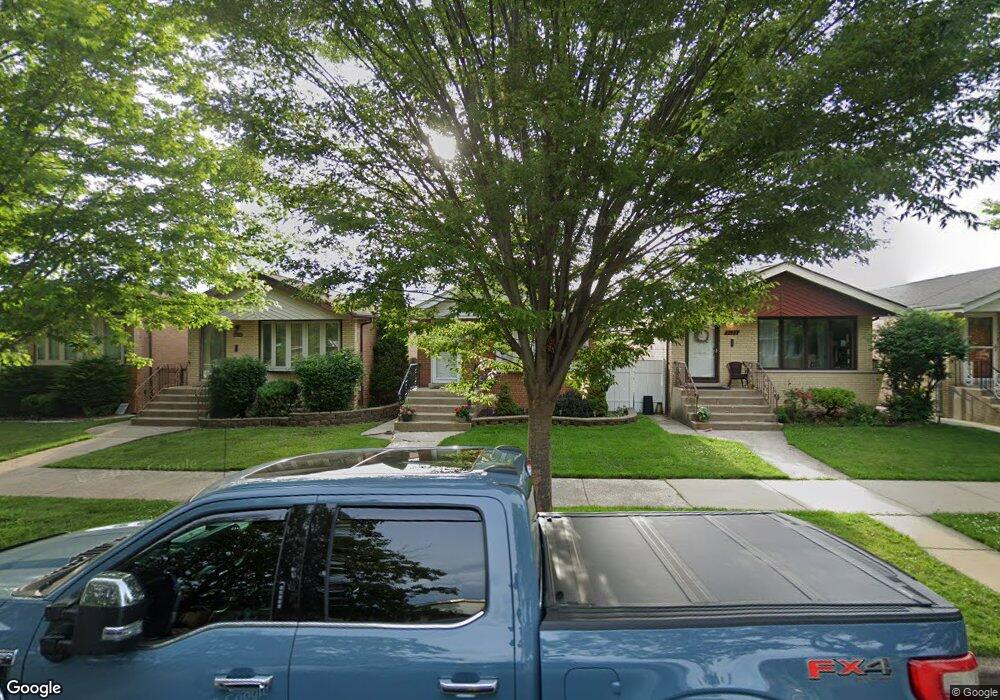
5131 S Nordica Ave Chicago, IL 60638
Garfield Ridge NeighborhoodEstimated Value: $318,000 - $365,000
3
Beds
2
Baths
1,750
Sq Ft
$198/Sq Ft
Est. Value
About This Home
This home is located at 5131 S Nordica Ave, Chicago, IL 60638 and is currently estimated at $345,679, approximately $197 per square foot. 5131 S Nordica Ave is a home located in Cook County with nearby schools including Byrne Elementary School, Kennedy High School, and St Daniel The Prophet School.
Ownership History
Date
Name
Owned For
Owner Type
Purchase Details
Closed on
Sep 18, 2017
Sold by
Coghlan James Malachy and Coghlan Erica S
Bought by
Haemker Neal A and Arambula Lissete
Current Estimated Value
Home Financials for this Owner
Home Financials are based on the most recent Mortgage that was taken out on this home.
Original Mortgage
$221,906
Outstanding Balance
$189,926
Interest Rate
4.87%
Mortgage Type
FHA
Estimated Equity
$155,753
Purchase Details
Closed on
Oct 19, 2009
Sold by
Bracken Timothy J
Bought by
Coghlan James Malachy and Coghlan Erica S
Home Financials for this Owner
Home Financials are based on the most recent Mortgage that was taken out on this home.
Original Mortgage
$204,300
Interest Rate
5.07%
Mortgage Type
VA
Purchase Details
Closed on
Jan 20, 2007
Sold by
Bracken Patrick and Gibson Nancy A
Bought by
Bracken Timothy J
Home Financials for this Owner
Home Financials are based on the most recent Mortgage that was taken out on this home.
Original Mortgage
$175,000
Interest Rate
6.25%
Mortgage Type
Unknown
Create a Home Valuation Report for This Property
The Home Valuation Report is an in-depth analysis detailing your home's value as well as a comparison with similar homes in the area
Home Values in the Area
Average Home Value in this Area
Purchase History
| Date | Buyer | Sale Price | Title Company |
|---|---|---|---|
| Haemker Neal A | $226,000 | Attorney | |
| Coghlan James Malachy | $200,000 | Cti | |
| Bracken Timothy J | $170,000 | Title America |
Source: Public Records
Mortgage History
| Date | Status | Borrower | Loan Amount |
|---|---|---|---|
| Open | Haemker Neal A | $221,906 | |
| Previous Owner | Coghlan James Malachy | $204,300 | |
| Previous Owner | Bracken Timothy J | $175,000 |
Source: Public Records
Tax History Compared to Growth
Tax History
| Year | Tax Paid | Tax Assessment Tax Assessment Total Assessment is a certain percentage of the fair market value that is determined by local assessors to be the total taxable value of land and additions on the property. | Land | Improvement |
|---|---|---|---|---|
| 2024 | $5,727 | $28,265 | $4,841 | $23,424 |
| 2023 | $5,585 | $29,266 | $4,323 | $24,943 |
| 2022 | $5,585 | $29,266 | $4,323 | $24,943 |
| 2021 | $5,429 | $26,999 | $4,322 | $22,677 |
| 2020 | $4,359 | $19,439 | $3,458 | $15,981 |
| 2019 | $4,367 | $21,599 | $3,458 | $18,141 |
| 2018 | $4,294 | $21,599 | $3,458 | $18,141 |
| 2017 | $2,520 | $15,003 | $3,112 | $11,891 |
| 2016 | $2,521 | $15,003 | $3,112 | $11,891 |
| 2015 | $2,285 | $15,003 | $3,112 | $11,891 |
| 2014 | $2,512 | $16,003 | $2,939 | $13,064 |
| 2013 | $2,452 | $16,003 | $2,939 | $13,064 |
Source: Public Records
Map
Nearby Homes
- 5148 S Newland Ave
- 7235 Park Ave
- 5359 S Nordica Ave
- 5137 S Rutherford Ave
- 5402 S 73rd Ave
- 5427 S Newcastle Ave
- 5415 S Oak Park Ave
- 5520 S New England Ave
- 7318 W Archer Ave
- 5112 S Nashville Ave
- 5605 S Nordica Ave
- 5532 S Oak Park Ave
- 7546 W Hanover St
- 5536 S Normandy Ave
- 5622 S Oak Park Ave
- 4536 Oak Park Ave
- 7341 56th Place
- 5250 S Nagle Ave
- 4515 Clinton Ave
- 4510 Kenilworth Ave
- 5133 S Nordica Ave
- 5135 S Nordica Ave
- 5129 S Nordica Ave
- 5141 S Nordica Ave
- 5143 S Nordica Ave
- 5130 S Sayre Ave
- 5128 S Sayre Ave
- 5136 S Sayre Ave
- 5149 S Nordica Ave
- 5124 S Sayre Ave
- 5140 S Sayre Ave
- 5142 S Sayre Ave
- 5151 S Nordica Ave
- 5146 S Sayre Ave
- 5132 S Nordica Ave
- 5134 S Nordica Ave
- 5130 S Nordica Ave
- 5136 S Nordica Ave
- 5126 S Nordica Ave