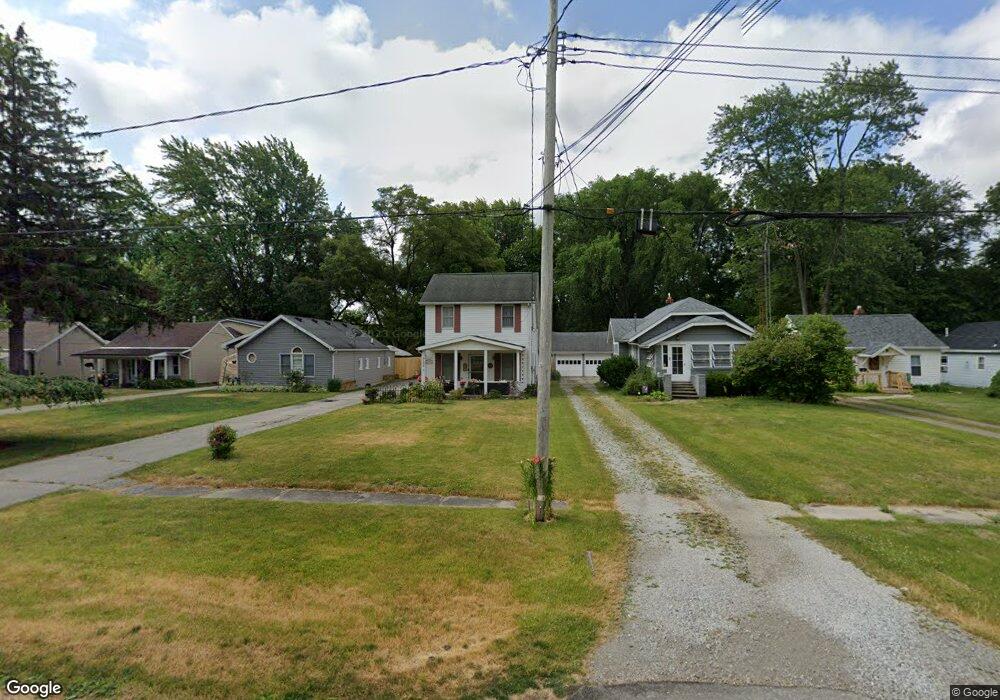
5135 Estess Ave Sylvania, OH 43560
Estimated Value: $125,000 - $174,000
2
Beds
1
Bath
960
Sq Ft
$149/Sq Ft
Est. Value
About This Home
This home is located at 5135 Estess Ave, Sylvania, OH 43560 and is currently estimated at $143,233, approximately $149 per square foot. 5135 Estess Ave is a home located in Lucas County with nearby schools including Hill View Elementary School, Sylvania Arbor Hills Junior High School, and Sylvania Northview High School.
Ownership History
Date
Name
Owned For
Owner Type
Purchase Details
Closed on
Jun 30, 2009
Sold by
Gerber Harold C and Gerber Rebecca R
Bought by
Venia Stokes Carol L
Current Estimated Value
Home Financials for this Owner
Home Financials are based on the most recent Mortgage that was taken out on this home.
Original Mortgage
$76,566
Outstanding Balance
$49,024
Interest Rate
4.94%
Mortgage Type
FHA
Estimated Equity
$94,209
Purchase Details
Closed on
Oct 14, 2008
Sold by
Deutsche Bank National Trust Company
Bought by
Gerber Harold C and Gerber Rebecca R
Purchase Details
Closed on
May 9, 2008
Sold by
Music William C
Bought by
Deutsche Bank National Trust Co
Purchase Details
Closed on
Dec 8, 2005
Sold by
Music William B and Music Alice F
Bought by
Music William C
Purchase Details
Closed on
Sep 28, 1989
Purchase Details
Closed on
Feb 23, 1989
Create a Home Valuation Report for This Property
The Home Valuation Report is an in-depth analysis detailing your home's value as well as a comparison with similar homes in the area
Home Values in the Area
Average Home Value in this Area
Purchase History
| Date | Buyer | Sale Price | Title Company |
|---|---|---|---|
| Venia Stokes Carol L | $78,000 | Liberty Title Inc | |
| Gerber Harold C | $29,000 | Prism Title & Closing Servic | |
| Deutsche Bank National Trust Co | $59,000 | None Available | |
| Music William C | $96,300 | World Title Agency Inc | |
| -- | -- | -- | |
| -- | -- | -- |
Source: Public Records
Mortgage History
| Date | Status | Borrower | Loan Amount |
|---|---|---|---|
| Open | Venia Stokes Carol L | $76,566 |
Source: Public Records
Tax History Compared to Growth
Tax History
| Year | Tax Paid | Tax Assessment Tax Assessment Total Assessment is a certain percentage of the fair market value that is determined by local assessors to be the total taxable value of land and additions on the property. | Land | Improvement |
|---|---|---|---|---|
| 2024 | $1,462 | $44,835 | $7,980 | $36,855 |
| 2023 | $2,091 | $27,300 | $5,320 | $21,980 |
| 2022 | $2,087 | $27,300 | $5,320 | $21,980 |
| 2021 | $2,137 | $27,300 | $5,320 | $21,980 |
| 2020 | $2,042 | $23,065 | $4,445 | $18,620 |
| 2019 | $1,968 | $23,065 | $4,445 | $18,620 |
| 2018 | $1,734 | $23,065 | $4,445 | $18,620 |
| 2017 | $1,622 | $17,220 | $6,405 | $10,815 |
| 2016 | $1,592 | $49,200 | $18,300 | $30,900 |
| 2015 | $1,503 | $49,200 | $18,300 | $30,900 |
| 2014 | $1,393 | $16,560 | $6,160 | $10,400 |
| 2013 | $1,393 | $16,560 | $6,160 | $10,400 |
Source: Public Records
Map
Nearby Homes
- 5117 Janet Ave
- 5910 Whiteford Rd
- 6028 Stewart Rd
- 6097 Huntington Rd
- 4832 Alexis Rd
- 5953 Rudyard Rd
- 5704 Webster Rd
- 6015 Rudyard Rd
- 5409 W Alexis Rd
- 6003 Roan Rd
- 6889 Highwarden St
- 6011 Meade Rd
- 6044 Meade Rd
- 6056 Meade Rd
- 6064 Meade Rd
- 6043 Meade Rd
- 6051 Meade Rd
- 6034 Roan Rd
- 6059 Roan Rd
- 6015 Roan Rd
- 5131 Estess Ave
- 5139 Estess Ave
- 5127 Estess Ave
- 5145 Estess Ave
- 5123 Estess Ave
- 5119 Estess Ave
- 5147 Estess Ave
- 5117 Estess Ave
- 5136 Estess Ave
- 5140 Estess Ave
- 5132 Estess Ave
- 5128 Estess Ave
- 5144 Estess Ave
- 5161 Estess Ave
- 5148 Estess Ave
- 5124 Estess Ave
- 5152 Estess Ave
- 5156 Estess Ave
- 5945 Whiteford Rd
- 5946 Artwell Dr