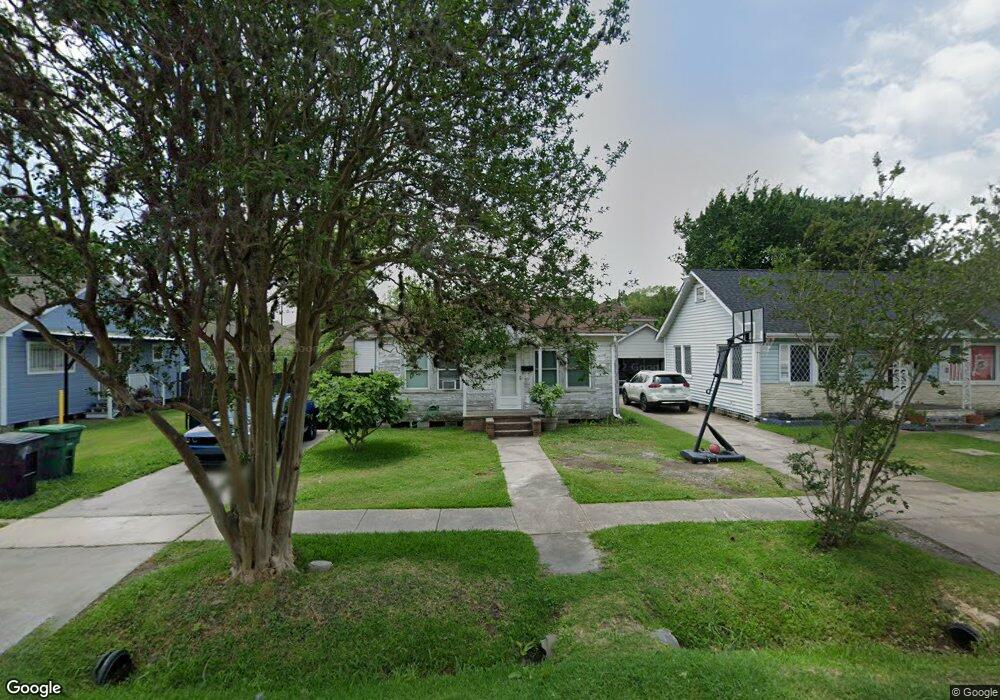
5140 Clay St Houston, TX 77023
Eastwood NeighborhoodEstimated Value: $235,069 - $304,000
3
Beds
1
Bath
1,052
Sq Ft
$260/Sq Ft
Est. Value
About This Home
This home is located at 5140 Clay St, Houston, TX 77023 and is currently estimated at $273,517, approximately $259 per square foot. 5140 Clay St is a home located in Harris County with nearby schools including Carrillo Elementary School, Yolanda Black Navarro Middle School, and Austin High School.
Ownership History
Date
Name
Owned For
Owner Type
Purchase Details
Closed on
Apr 8, 2013
Sold by
Sosa Miguel
Bought by
Sosa Miguel and Sosa Elizabeth Santos
Current Estimated Value
Purchase Details
Closed on
Oct 22, 2012
Sold by
Sosa Miguel
Bought by
Sosa Miguel
Purchase Details
Closed on
Oct 20, 2006
Sold by
Braley Linda Gracey and Braley Robert Alvin
Bought by
Sosa Miguel and Sosa Maria Garza
Home Financials for this Owner
Home Financials are based on the most recent Mortgage that was taken out on this home.
Original Mortgage
$48,900
Interest Rate
6.41%
Mortgage Type
Seller Take Back
Create a Home Valuation Report for This Property
The Home Valuation Report is an in-depth analysis detailing your home's value as well as a comparison with similar homes in the area
Home Values in the Area
Average Home Value in this Area
Purchase History
| Date | Buyer | Sale Price | Title Company |
|---|---|---|---|
| Sosa Miguel | -- | None Available | |
| Sosa Miguel | -- | None Available | |
| Sosa Miguel | -- | None Available |
Source: Public Records
Mortgage History
| Date | Status | Borrower | Loan Amount |
|---|---|---|---|
| Previous Owner | Sosa Miguel | $48,900 |
Source: Public Records
Tax History Compared to Growth
Tax History
| Year | Tax Paid | Tax Assessment Tax Assessment Total Assessment is a certain percentage of the fair market value that is determined by local assessors to be the total taxable value of land and additions on the property. | Land | Improvement |
|---|---|---|---|---|
| 2025 | $2,222 | $220,854 | $150,000 | $70,854 |
| 2024 | $2,222 | $219,431 | $150,000 | $69,431 |
| 2023 | $2,222 | $219,431 | $150,000 | $69,431 |
| 2022 | $3,582 | $179,305 | $120,000 | $59,305 |
| 2021 | $3,227 | $150,869 | $95,000 | $55,869 |
| 2020 | $3,237 | $148,601 | $95,000 | $53,601 |
| 2019 | $3,067 | $148,680 | $95,000 | $53,680 |
| 2018 | $1,815 | $142,010 | $91,250 | $50,760 |
| 2017 | $2,533 | $130,101 | $80,000 | $50,101 |
| 2016 | $2,303 | $119,056 | $65,000 | $54,056 |
| 2015 | $1,729 | $99,416 | $42,500 | $56,916 |
| 2014 | $1,729 | $67,275 | $29,000 | $38,275 |
Source: Public Records
Map
Nearby Homes
- 5223 Clay St
- 5129 Polk St
- 5125 Polk St
- 5136 Leeland St
- 4976 Polk St
- 5120 Leeland St
- 5244 Leeland St
- 1207 Collier St
- 1108 Wyatt St
- 5022 Stimson St
- 5319 Bell St
- 4918 Polk St
- 5105 Lindsay St
- 4924 Park Dr
- 5312 Jefferson St
- 1303 Lansing St Unit 1
- 5213 Claremont St
- 5005 Mckinney St
- 5217 Claremont St
- 5221 Claremont St