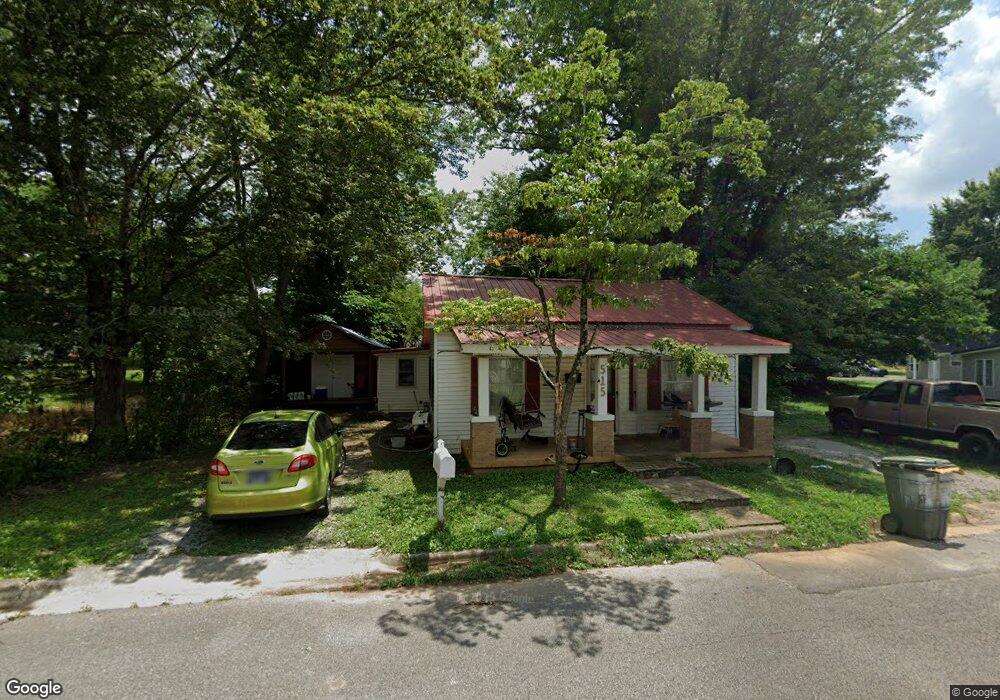
515 5th St Lawrenceburg, TN 38464
Estimated Value: $43,000 - $76,000
--
Bed
1
Bath
875
Sq Ft
$69/Sq Ft
Est. Value
About This Home
This home is located at 515 5th St, Lawrenceburg, TN 38464 and is currently estimated at $60,054, approximately $68 per square foot. 515 5th St is a home located in Lawrence County with nearby schools including Ingram Sowell Elementary School, Lawrenceburg Public Elementary School, and David Crockett Elementary School.
Ownership History
Date
Name
Owned For
Owner Type
Purchase Details
Closed on
Mar 7, 2025
Sold by
Harris Randall
Bought by
Finn Duke and Cole Duke Cole
Current Estimated Value
Home Financials for this Owner
Home Financials are based on the most recent Mortgage that was taken out on this home.
Original Mortgage
$40,000
Outstanding Balance
$35,433
Interest Rate
6.95%
Mortgage Type
New Conventional
Estimated Equity
$24,621
Purchase Details
Closed on
May 5, 2015
Sold by
Wheeley Brent
Bought by
Harris Randall
Purchase Details
Closed on
Mar 9, 2015
Sold by
Wheeley Brent and Wheeley Josh Duke
Bought by
Wheeley Brent and Wheeley Josh Duke
Purchase Details
Closed on
Nov 6, 2009
Sold by
Hazelwood Percy
Bought by
Wheeley Brent
Purchase Details
Closed on
Aug 18, 1995
Sold by
Potts and Wife
Bought by
Story and Patsy
Purchase Details
Closed on
Mar 2, 1987
Bought by
Potts Raymond and Wife Ruthanna
Create a Home Valuation Report for This Property
The Home Valuation Report is an in-depth analysis detailing your home's value as well as a comparison with similar homes in the area
Home Values in the Area
Average Home Value in this Area
Purchase History
| Date | Buyer | Sale Price | Title Company |
|---|---|---|---|
| Finn Duke | $50,000 | None Listed On Document | |
| Finn Duke | $50,000 | None Listed On Document | |
| Harris Randall | $21,952 | -- | |
| Wheeley Brent | -- | -- | |
| Duke Josh | -- | -- | |
| Wheeley Brent | $10,800 | -- | |
| Hazelwood | $25,000 | -- | |
| Story | $20,750 | -- | |
| Potts Raymond | -- | -- |
Source: Public Records
Mortgage History
| Date | Status | Borrower | Loan Amount |
|---|---|---|---|
| Open | Finn Duke | $40,000 | |
| Closed | Finn Duke | $40,000 | |
| Previous Owner | Potts Raymond | $25,000 |
Source: Public Records
Tax History Compared to Growth
Tax History
| Year | Tax Paid | Tax Assessment Tax Assessment Total Assessment is a certain percentage of the fair market value that is determined by local assessors to be the total taxable value of land and additions on the property. | Land | Improvement |
|---|---|---|---|---|
| 2025 | $359 | $11,550 | $0 | $0 |
| 2024 | $359 | $11,550 | $1,500 | $10,050 |
| 2023 | $359 | $11,550 | $1,500 | $10,050 |
| 2022 | $359 | $11,550 | $1,500 | $10,050 |
| 2021 | $251 | $5,725 | $1,500 | $4,225 |
| 2020 | $251 | $5,725 | $1,500 | $4,225 |
| 2019 | $251 | $5,725 | $1,500 | $4,225 |
| 2018 | $251 | $5,725 | $1,500 | $4,225 |
| 2017 | $251 | $5,725 | $1,500 | $4,225 |
| 2016 | $251 | $5,725 | $1,500 | $4,225 |
| 2015 | $238 | $5,725 | $1,500 | $4,225 |
| 2014 | $275 | $6,600 | $1,500 | $5,100 |
Source: Public Records
Map
Nearby Homes