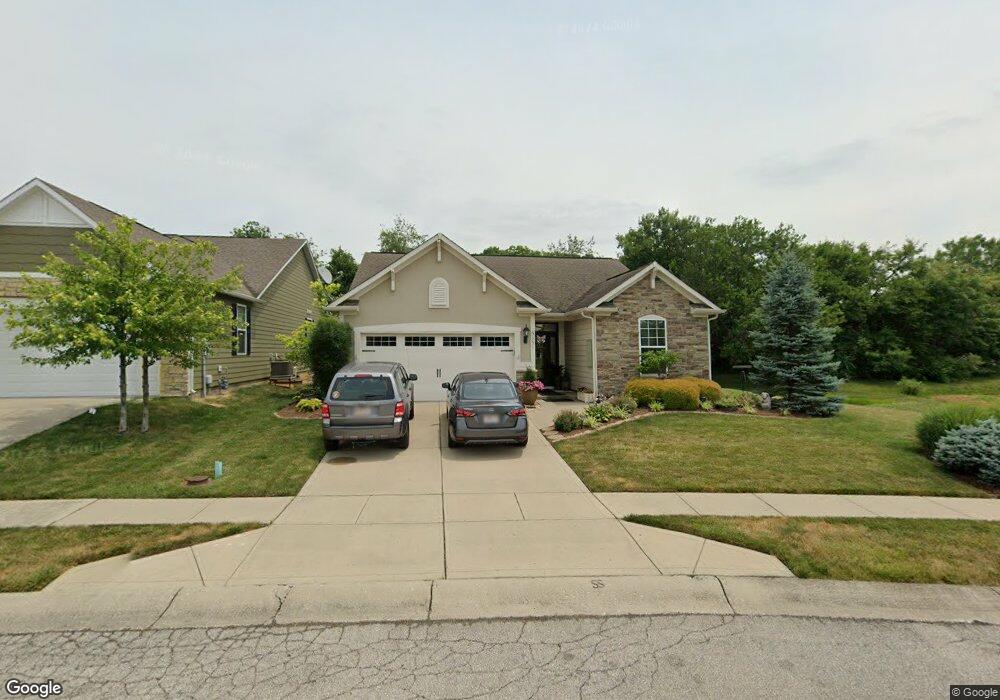
5151 Melville Way Indianapolis, IN 46239
Galludet NeighborhoodEstimated Value: $293,000 - $331,000
2
Beds
2
Baths
1,861
Sq Ft
$166/Sq Ft
Est. Value
About This Home
This home is located at 5151 Melville Way, Indianapolis, IN 46239 and is currently estimated at $309,834, approximately $166 per square foot. 5151 Melville Way is a home located in Marion County with nearby schools including Franklin Central High School and Nativity Catholic School.
Ownership History
Date
Name
Owned For
Owner Type
Purchase Details
Closed on
Dec 9, 2021
Sold by
Hancock Marcia A
Bought by
Hancock Michael L and Hancock Marcia A
Current Estimated Value
Home Financials for this Owner
Home Financials are based on the most recent Mortgage that was taken out on this home.
Original Mortgage
$200,000
Outstanding Balance
$183,898
Interest Rate
3.09%
Estimated Equity
$125,936
Purchase Details
Closed on
Dec 8, 2021
Sold by
Hancock Marcia A and Anness Marcia A
Bought by
Hancock Michael L and Hancock Marcia A
Home Financials for this Owner
Home Financials are based on the most recent Mortgage that was taken out on this home.
Original Mortgage
$200,000
Outstanding Balance
$183,898
Interest Rate
3.09%
Estimated Equity
$125,936
Purchase Details
Closed on
Sep 11, 2007
Sold by
Village Of New Bethel Llc
Bought by
Hasen & Horn Inc
Create a Home Valuation Report for This Property
The Home Valuation Report is an in-depth analysis detailing your home's value as well as a comparison with similar homes in the area
Home Values in the Area
Average Home Value in this Area
Purchase History
| Date | Buyer | Sale Price | Title Company |
|---|---|---|---|
| Hancock Michael L | -- | None Available | |
| Hancock Michael L | -- | None Listed On Document | |
| Hasen & Horn Inc | -- | None Available |
Source: Public Records
Mortgage History
| Date | Status | Borrower | Loan Amount |
|---|---|---|---|
| Open | Hancock Michael L | $200,000 | |
| Closed | Hancock Michael L | $200,000 |
Source: Public Records
Tax History Compared to Growth
Tax History
| Year | Tax Paid | Tax Assessment Tax Assessment Total Assessment is a certain percentage of the fair market value that is determined by local assessors to be the total taxable value of land and additions on the property. | Land | Improvement |
|---|---|---|---|---|
| 2024 | $2,683 | $268,200 | $38,800 | $229,400 |
| 2023 | $2,683 | $257,700 | $38,800 | $218,900 |
| 2022 | $4,986 | $241,800 | $38,800 | $203,000 |
| 2021 | $2,288 | $218,600 | $38,800 | $179,800 |
| 2020 | $2,142 | $204,300 | $38,800 | $165,500 |
| 2019 | $2,017 | $192,000 | $28,400 | $163,600 |
| 2018 | $1,968 | $187,400 | $28,400 | $159,000 |
| 2017 | $1,844 | $175,200 | $28,400 | $146,800 |
| 2016 | $1,793 | $170,300 | $28,400 | $141,900 |
| 2014 | $1,786 | $178,600 | $28,400 | $150,200 |
| 2013 | $1,786 | $178,600 | $28,400 | $150,200 |
Source: Public Records
Map
Nearby Homes
- 8835 Melville Ct
- 8750 Twain Ln
- 5043 Gerhing Dr
- 8801 Twain Ln
- 8737 Twain Ln
- 9101 Gordimer Cir
- 8643 Twain Ln
- 8804 Faulkner Dr
- 9053 Fitzgerald Dr
- 9018 Faulkner Dr
- 9138 Hemingway Dr
- 9114 Steinbeck Ln
- 9133 Fitzgerald Dr
- 9132 Steinbeck Ln
- 9126 Steinbeck Ln
- 5528 Tart Blvd
- 9138 Steinbeck Ln
- 9119 Steinbeck Ln
- 8426 Grand Appaloosa Way
- 8444 Grand Appaloosa Way
- 5145 Melville Way
- 5139 Melville Way
- 5133 Melville Way
- 5146 Melville Way
- 8844 Carver Dr
- 5140 Melville Way
- 5127 Melville Way
- 8838 Carver Dr
- 8837 Kipling Dr
- 5121 Melville Way
- 8848 Kipling Dr
- 8832 Carver Dr
- 8831 Kipling Dr
- 8842 Kipling Dr
- 8904 Hemingway Dr
- 5115 Melville Way
- 8836 Kipling Dr
- 8910 Hemingway Dr
- 8826 Carver Dr
- 8825 Kipling Dr