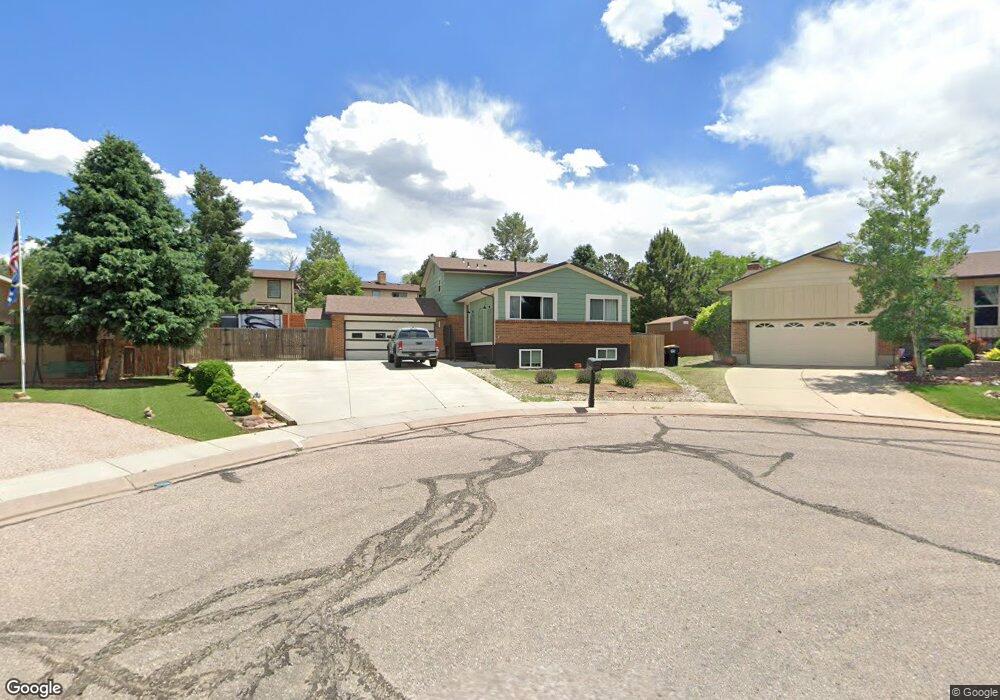
5155 Mayweed Ct Colorado Springs, CO 80917
Old Farms NeighborhoodEstimated Value: $401,043 - $476,000
3
Beds
3
Baths
1,073
Sq Ft
$412/Sq Ft
Est. Value
About This Home
This home is located at 5155 Mayweed Ct, Colorado Springs, CO 80917 and is currently estimated at $442,511, approximately $412 per square foot. 5155 Mayweed Ct is a home located in El Paso County with nearby schools including Rudy Elementary School, Sabin Middle School, and Doherty High School.
Ownership History
Date
Name
Owned For
Owner Type
Purchase Details
Closed on
Dec 21, 2012
Sold by
Bower David C and Bower Tanja
Bought by
Dowdel Patrick J and Dowdel Patricia M
Current Estimated Value
Home Financials for this Owner
Home Financials are based on the most recent Mortgage that was taken out on this home.
Original Mortgage
$220,000
Outstanding Balance
$152,424
Interest Rate
3.37%
Mortgage Type
VA
Estimated Equity
$290,087
Purchase Details
Closed on
May 23, 2008
Sold by
Kelling Jimmie L and Kelling Roger Lynn
Bought by
Bower David C and Bower Tanja
Home Financials for this Owner
Home Financials are based on the most recent Mortgage that was taken out on this home.
Original Mortgage
$198,878
Interest Rate
5.89%
Mortgage Type
FHA
Purchase Details
Closed on
May 1, 1985
Bought by
Dowdel Patricia M
Purchase Details
Closed on
Aug 1, 1979
Bought by
Dowdel Patrick J
Create a Home Valuation Report for This Property
The Home Valuation Report is an in-depth analysis detailing your home's value as well as a comparison with similar homes in the area
Home Values in the Area
Average Home Value in this Area
Purchase History
| Date | Buyer | Sale Price | Title Company |
|---|---|---|---|
| Dowdel Patrick J | $220,000 | Stewart Title | |
| Bower David C | $201,999 | Security Title | |
| Dowdel Patricia M | -- | -- | |
| Dowdel Patrick J | -- | -- |
Source: Public Records
Mortgage History
| Date | Status | Borrower | Loan Amount |
|---|---|---|---|
| Open | Dowdel Patrick J | $220,000 | |
| Previous Owner | Bower David C | $198,878 |
Source: Public Records
Tax History Compared to Growth
Tax History
| Year | Tax Paid | Tax Assessment Tax Assessment Total Assessment is a certain percentage of the fair market value that is determined by local assessors to be the total taxable value of land and additions on the property. | Land | Improvement |
|---|---|---|---|---|
| 2025 | $1,441 | $30,840 | -- | -- |
| 2024 | $1,327 | $30,350 | $5,490 | $24,860 |
| 2023 | $1,327 | $30,350 | $5,490 | $24,860 |
| 2022 | $1,275 | $22,780 | $4,170 | $18,610 |
| 2021 | $1,383 | $23,430 | $4,290 | $19,140 |
| 2020 | $1,356 | $19,980 | $3,720 | $16,260 |
| 2019 | $1,349 | $19,980 | $3,720 | $16,260 |
| 2018 | $1,265 | $17,240 | $3,240 | $14,000 |
| 2017 | $1,198 | $17,240 | $3,240 | $14,000 |
| 2016 | $1,031 | $17,780 | $2,710 | $15,070 |
| 2015 | $1,027 | $17,780 | $2,710 | $15,070 |
| 2014 | $810 | $13,460 | $2,710 | $10,750 |
Source: Public Records
Map
Nearby Homes
- 5210 Coneflower Ln
- 4504 Bell Flower Dr
- 5190 Thistle Ct
- 5183 Solar Ridge Dr
- 5117 Solar Ridge Dr
- 5002 Barnes Rd
- 5256 Mountain Peak Point
- 5102 Rainbow Harbour Cir
- 4842 S Old Brook Cir
- 4336 Adam Mark Point
- 4878 S Old Brook Cir
- 4955 Chickweed Dr
- 4652 Excalibur Ct
- 5441 E Old Farm Cir
- 5440 Jennifer Ln
- 4450 Chaparral Rd
- 4763 Yarrow Place
- 4958 Wood Brook Ct
- 4626 High Springs Ct
- 4644 High Springs Ct
- 5145 Mayweed Ct
- 4516 Bell Flower Dr
- 5160 Mayweed Ct
- 5180 Coneflower Ln
- 4532 Bell Flower Dr
- 5170 Coneflower Ln
- 5150 Mayweed Ct
- 5135 Mayweed Ct
- 5179 Bitterweed Ln
- 5160 Coneflower Ln
- 5167 Bitterweed Ln
- 5140 Mayweed Ct
- 5191 Bitterweed Ln
- 5125 Mayweed Ct
- 5150 Coneflower Ln
- 5155 Bitterweed Ln
- 5130 Mayweed Ct
- 5143 Bitterweed Ln
- 5215 Coneflower Ln
- 4495 Bell Flower Dr