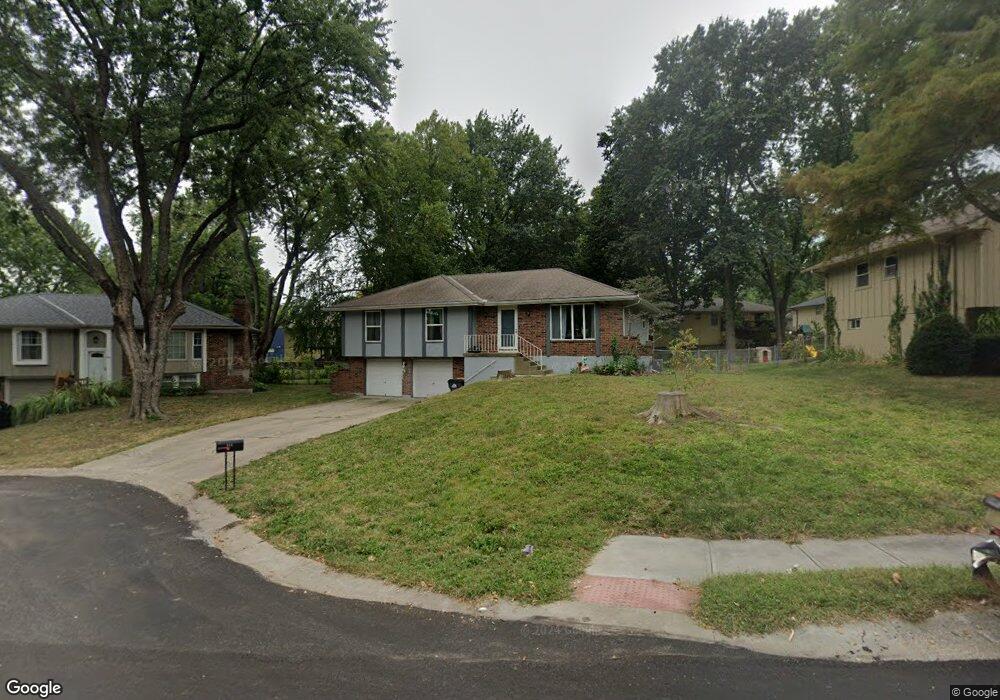
516 NE Johnston Dr Blue Springs, MO 64014
Estimated Value: $281,131 - $306,000
3
Beds
2
Baths
1,404
Sq Ft
$207/Sq Ft
Est. Value
About This Home
This home is located at 516 NE Johnston Dr, Blue Springs, MO 64014 and is currently estimated at $290,533, approximately $206 per square foot. 516 NE Johnston Dr is a home located in Jackson County with nearby schools including Lucy Franklin Elementary School, Brittany Hill Middle School, and Blue Springs High School.
Ownership History
Date
Name
Owned For
Owner Type
Purchase Details
Closed on
Mar 4, 2022
Sold by
Adams Stephen R and Adams Barbara
Bought by
Adams Mitchell R
Current Estimated Value
Home Financials for this Owner
Home Financials are based on the most recent Mortgage that was taken out on this home.
Original Mortgage
$95,500
Outstanding Balance
$77,066
Interest Rate
3.15%
Mortgage Type
New Conventional
Estimated Equity
$213,467
Purchase Details
Closed on
Dec 12, 2008
Sold by
Adams Stephen R
Bought by
Adams Stephen R and Adams Mitchell R
Purchase Details
Closed on
Jun 26, 1998
Sold by
Patel Jayantibhai S and Patel Pushpa
Bought by
Adams Stephen R
Home Financials for this Owner
Home Financials are based on the most recent Mortgage that was taken out on this home.
Original Mortgage
$49,500
Interest Rate
7.13%
Mortgage Type
Purchase Money Mortgage
Create a Home Valuation Report for This Property
The Home Valuation Report is an in-depth analysis detailing your home's value as well as a comparison with similar homes in the area
Home Values in the Area
Average Home Value in this Area
Purchase History
| Date | Buyer | Sale Price | Title Company |
|---|---|---|---|
| Adams Mitchell R | -- | None Listed On Document | |
| Adams Mitchell R | -- | None Listed On Document | |
| Adams Stephen R | -- | Kansas City Title | |
| Adams Stephen R | -- | Stewart Title |
Source: Public Records
Mortgage History
| Date | Status | Borrower | Loan Amount |
|---|---|---|---|
| Open | Adams Mitchell R | $95,500 | |
| Previous Owner | Adams Stephen R | $49,500 |
Source: Public Records
Tax History Compared to Growth
Tax History
| Year | Tax Paid | Tax Assessment Tax Assessment Total Assessment is a certain percentage of the fair market value that is determined by local assessors to be the total taxable value of land and additions on the property. | Land | Improvement |
|---|---|---|---|---|
| 2025 | $3,067 | $38,696 | $5,575 | $33,121 |
| 2024 | $3,067 | $37,597 | $4,583 | $33,014 |
| 2023 | $3,008 | $37,597 | $4,448 | $33,149 |
| 2022 | $2,649 | $29,260 | $6,318 | $22,942 |
| 2021 | $2,647 | $29,260 | $6,318 | $22,942 |
| 2020 | $2,479 | $27,877 | $6,318 | $21,559 |
| 2019 | $2,397 | $27,877 | $6,318 | $21,559 |
| 2018 | $2,451 | $27,439 | $4,280 | $23,159 |
| 2017 | $2,451 | $27,439 | $4,280 | $23,159 |
| 2016 | $2,383 | $26,752 | $3,287 | $23,465 |
| 2014 | $2,128 | $23,815 | $3,392 | $20,423 |
Source: Public Records
Map
Nearby Homes
- 517 NE Johnston Dr
- 816 NE Mary Ct
- 404 NE Lee Dr
- 311 NE Bridge Place
- 420 NE Golfview Dr
- 1800 NE Waterfield Village Ct
- 1001 NE Wien Ave
- 105 NE Leann Dr
- 2515 NE Springbrook St
- 1912 NW Manor Dr
- 280 NW Beau Dr
- 1320 NE Quail Walk Dr
- 204 NW Golfview Dr
- 1136 NE 10th St
- 2400 NW 1st St
- 705 NE Locust Dr
- 1204 NE Quail Walk Dr
- 2615 NE Springbrook St
- 607 NE Field Creek Dr
- 1200 NE Crestview Dr
- 520 NE Johnston Dr
- 512 NE Johnston Dr
- 524 NE Johnston Dr
- 509 NE Grant Dr
- 517 NE Grant Dr
- 508 NE Johnston Dr
- 513 NE Johnston Dr
- 525 NE Johnston Dr
- 505 NE Grant Dr
- 521 NE Grant Dr
- 504 NE Johnston Dr
- 505 NE Johnston Dr
- 501 NE Grant Dr
- 520 NE Lee Dr
- 516 NE Grant Dr
- 500 NE Johnston Dr
- 504 NE Grant Dr
- 508 NE Grant Dr
- 516 NE Lee Dr
- 512 NE Grant Dr