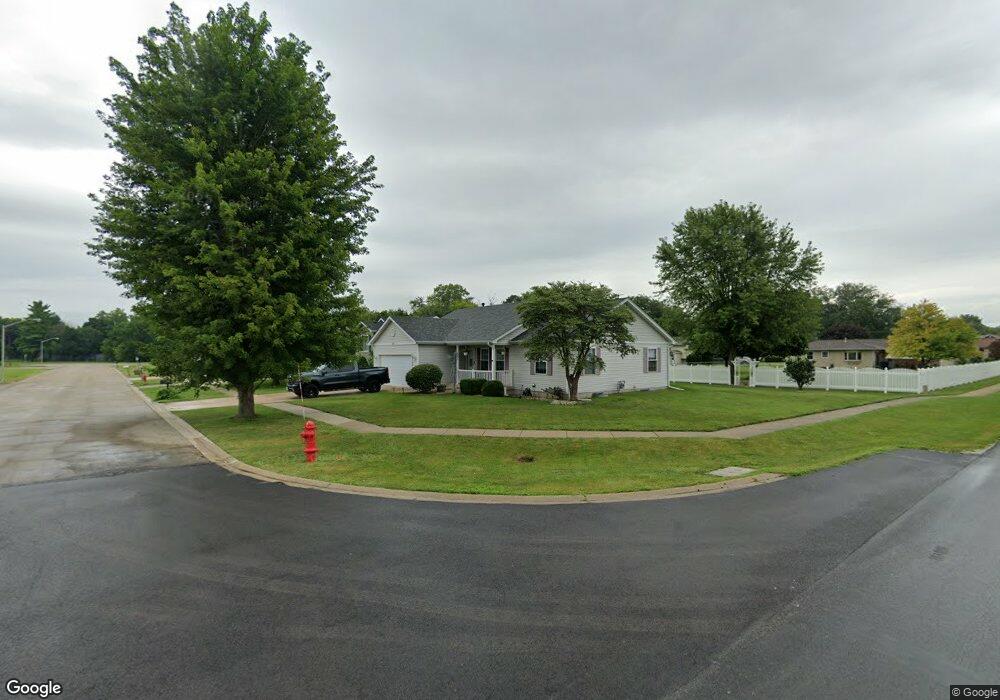
517 Loraine St Earlville, IL 60518
Estimated Value: $245,966 - $314,000
3
Beds
2
Baths
1,278
Sq Ft
$212/Sq Ft
Est. Value
About This Home
This home is located at 517 Loraine St, Earlville, IL 60518 and is currently estimated at $270,742, approximately $211 per square foot. 517 Loraine St is a home located in LaSalle County with nearby schools including Earlville Elementary School and Earlville Junior/Senior High School.
Ownership History
Date
Name
Owned For
Owner Type
Purchase Details
Closed on
Apr 24, 2014
Sold by
Glant Ashley M
Bought by
Glant Joshua C
Current Estimated Value
Purchase Details
Closed on
Apr 23, 2010
Sold by
Mikolasek Raymond P and Mikolasek Terri
Bought by
Glant Joshua and Glant Ashley
Home Financials for this Owner
Home Financials are based on the most recent Mortgage that was taken out on this home.
Original Mortgage
$158,083
Outstanding Balance
$104,608
Interest Rate
4.87%
Mortgage Type
FHA
Estimated Equity
$166,134
Create a Home Valuation Report for This Property
The Home Valuation Report is an in-depth analysis detailing your home's value as well as a comparison with similar homes in the area
Home Values in the Area
Average Home Value in this Area
Purchase History
| Date | Buyer | Sale Price | Title Company |
|---|---|---|---|
| Glant Joshua C | -- | None Available | |
| Glant Joshua | $161,000 | None Available |
Source: Public Records
Mortgage History
| Date | Status | Borrower | Loan Amount |
|---|---|---|---|
| Open | Glant Joshua | $158,083 |
Source: Public Records
Tax History Compared to Growth
Tax History
| Year | Tax Paid | Tax Assessment Tax Assessment Total Assessment is a certain percentage of the fair market value that is determined by local assessors to be the total taxable value of land and additions on the property. | Land | Improvement |
|---|---|---|---|---|
| 2024 | $5,211 | $68,164 | $2,835 | $65,329 |
| 2023 | $4,712 | $60,210 | $2,504 | $57,706 |
| 2022 | $3,993 | $49,957 | $12,031 | $37,926 |
| 2021 | $4,068 | $49,102 | $11,825 | $37,277 |
| 2020 | $3,930 | $47,631 | $11,471 | $36,160 |
| 2019 | $3,829 | $45,571 | $10,975 | $34,596 |
| 2018 | $3,734 | $43,823 | $10,554 | $33,269 |
| 2017 | $3,444 | $39,996 | $9,633 | $30,363 |
| 2016 | $3,258 | $37,380 | $9,003 | $28,377 |
| 2015 | $3,124 | $35,815 | $8,626 | $27,189 |
| 2012 | -- | $48,007 | $10,135 | $37,872 |
Source: Public Records
Map
Nearby Homes