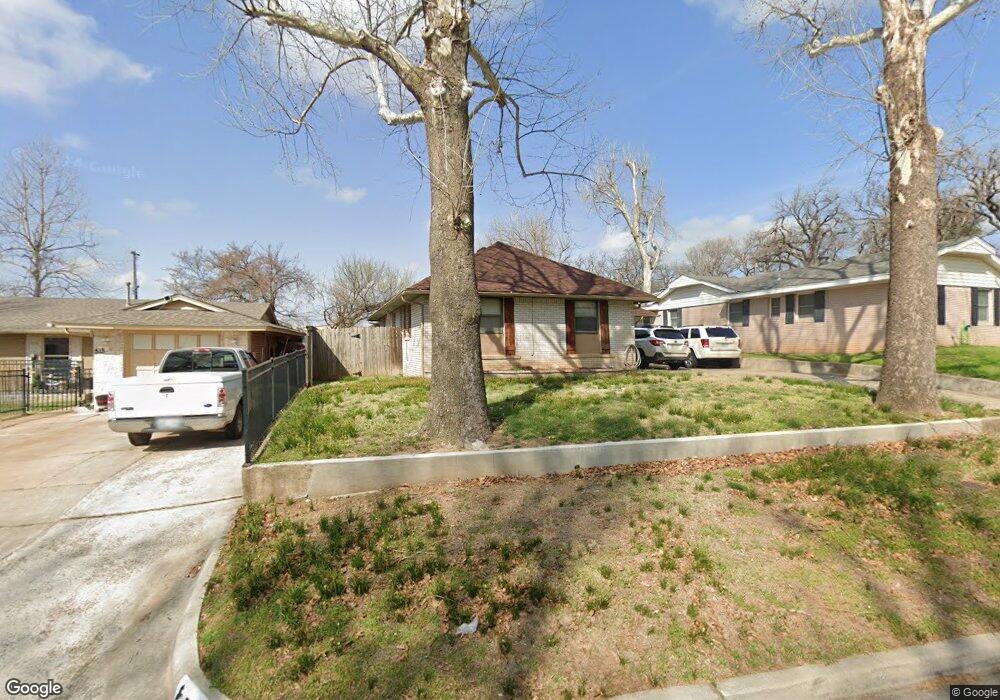
517 Skylark Dr Oklahoma City, OK 73127
WesTen NeighborhoodEstimated Value: $160,443 - $197,000
2
Beds
1
Bath
1,428
Sq Ft
$123/Sq Ft
Est. Value
About This Home
This home is located at 517 Skylark Dr, Oklahoma City, OK 73127 and is currently estimated at $175,611, approximately $122 per square foot. 517 Skylark Dr is a home located in Oklahoma County with nearby schools including Council Grove Elementary School, Western Heights Middle School, and Western Heights High School.
Ownership History
Date
Name
Owned For
Owner Type
Purchase Details
Closed on
Nov 1, 2006
Sold by
Cordry Sean and Case #Cj-2006-1646
Bought by
Centex Home Equity Co Llc
Current Estimated Value
Home Financials for this Owner
Home Financials are based on the most recent Mortgage that was taken out on this home.
Original Mortgage
$82,603
Outstanding Balance
$49,052
Interest Rate
6.28%
Mortgage Type
FHA
Estimated Equity
$126,559
Purchase Details
Closed on
Oct 31, 2006
Sold by
Nationstar Mortgage Llc
Bought by
Wright Adam and Wright Marla G
Home Financials for this Owner
Home Financials are based on the most recent Mortgage that was taken out on this home.
Original Mortgage
$82,603
Outstanding Balance
$49,052
Interest Rate
6.28%
Mortgage Type
FHA
Estimated Equity
$126,559
Purchase Details
Closed on
Jul 21, 2006
Sold by
Cordry Sean
Bought by
Centex Home Equity Co Llc
Purchase Details
Closed on
Apr 22, 1998
Sold by
Landers Sidney C
Bought by
Cordry Sean and Cordry Tammy
Create a Home Valuation Report for This Property
The Home Valuation Report is an in-depth analysis detailing your home's value as well as a comparison with similar homes in the area
Home Values in the Area
Average Home Value in this Area
Purchase History
| Date | Buyer | Sale Price | Title Company |
|---|---|---|---|
| Centex Home Equity Co Llc | -- | None Available | |
| Wright Adam | $83,900 | Oklahoma Reo Closing & Title | |
| Centex Home Equity Co Llc | -- | None Available | |
| Cordry Sean | $56,000 | -- |
Source: Public Records
Mortgage History
| Date | Status | Borrower | Loan Amount |
|---|---|---|---|
| Open | Wright Adam | $82,603 |
Source: Public Records
Tax History Compared to Growth
Tax History
| Year | Tax Paid | Tax Assessment Tax Assessment Total Assessment is a certain percentage of the fair market value that is determined by local assessors to be the total taxable value of land and additions on the property. | Land | Improvement |
|---|---|---|---|---|
| 2024 | $1,459 | $13,126 | $1,555 | $11,571 |
| 2023 | $1,459 | $12,501 | $1,591 | $10,910 |
| 2022 | $1,405 | $11,904 | $1,723 | $10,181 |
| 2021 | $1,373 | $11,338 | $1,938 | $9,400 |
| 2020 | $1,267 | $10,799 | $2,289 | $8,510 |
| 2019 | $1,222 | $10,285 | $2,308 | $7,977 |
| 2018 | $1,202 | $10,049 | $0 | $0 |
| 2017 | $1,141 | $9,569 | $2,308 | $7,261 |
| 2016 | $1,078 | $9,129 | $2,318 | $6,811 |
| 2015 | $1,070 | $8,991 | $2,318 | $6,673 |
| 2014 | $1,035 | $8,752 | $2,318 | $6,434 |
Source: Public Records
Map
Nearby Homes
- 521 Skylark Dr
- 501 N Tompkins Dr
- 7804 NW 5th St
- 509 Flamingo Ave
- 7815 NW 6th St
- 7818 NW 8th St
- 8017 NW 8th Terrace Unit 196
- 822 Greenvale Rd
- 7416 NW 6th Terrace
- 7417 NW 7th St
- 10501 NW 10th St
- 804 N Anita Dr
- 7529 NW 11th St
- 8300 NW 10th St Unit 32
- 7609 NW 14th St
- 8029 NW 15th St
- 1516 N Markwell Place
- 1540 Bradley Place
- 1925 Melanie Dr
- 1601 N Markwell Place