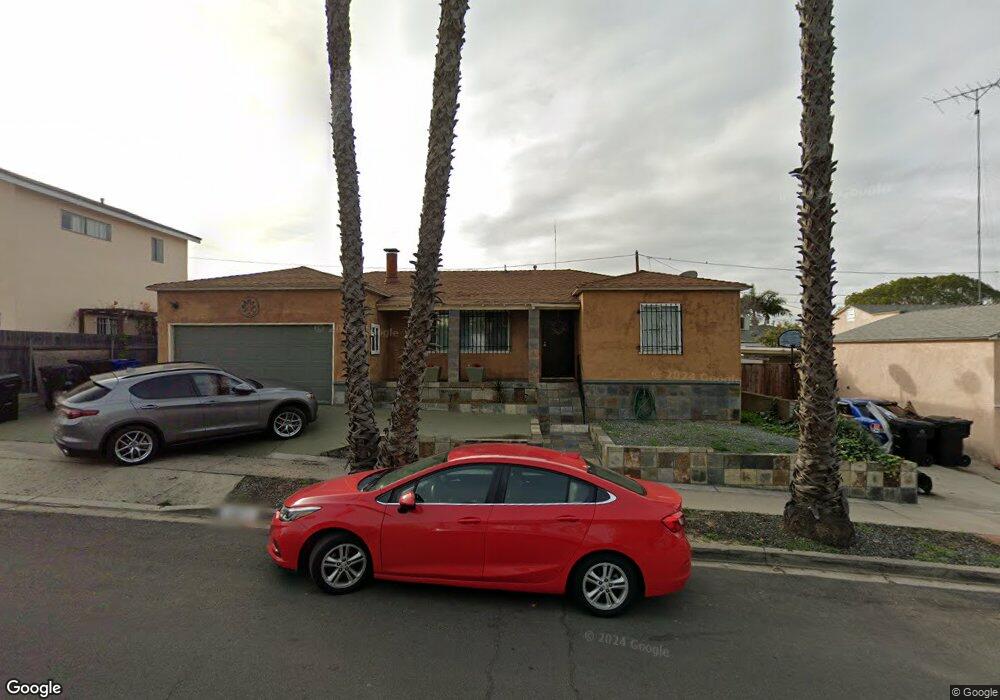
5171 Krenning St San Diego, CA 92105
Oak Park NeighborhoodEstimated Value: $604,512 - $802,000
3
Beds
2
Baths
1,145
Sq Ft
$600/Sq Ft
Est. Value
About This Home
This home is located at 5171 Krenning St, San Diego, CA 92105 and is currently estimated at $686,628, approximately $599 per square foot. 5171 Krenning St is a home located in San Diego County with nearby schools including Oak Park Elementary School, Mann Middle School, and Crawford High School.
Ownership History
Date
Name
Owned For
Owner Type
Purchase Details
Closed on
Mar 4, 2024
Sold by
Pinkston Bralie S and Bralie S Pinkston Living Trust
Bought by
Pinkston-Brown Bralie
Current Estimated Value
Home Financials for this Owner
Home Financials are based on the most recent Mortgage that was taken out on this home.
Original Mortgage
$60,000
Outstanding Balance
$57,742
Interest Rate
6.69%
Mortgage Type
New Conventional
Estimated Equity
$628,886
Purchase Details
Closed on
Feb 27, 2024
Sold by
Brown Anthony
Bought by
Pinkston-Brown Bralie
Home Financials for this Owner
Home Financials are based on the most recent Mortgage that was taken out on this home.
Original Mortgage
$60,000
Outstanding Balance
$57,742
Interest Rate
6.69%
Mortgage Type
New Conventional
Estimated Equity
$628,886
Purchase Details
Closed on
Oct 24, 2022
Sold by
Pinkston-Brown Bralie
Bought by
Bralie S Pinkston Living Trust
Purchase Details
Closed on
Sep 14, 2022
Sold by
Anthony Brown
Bought by
Pinkston-Brown Bralie
Purchase Details
Closed on
Apr 13, 2017
Sold by
Brown Anthony
Bought by
Brown Bralie Pinkston and Brown Anthony
Home Financials for this Owner
Home Financials are based on the most recent Mortgage that was taken out on this home.
Original Mortgage
$400,000
Interest Rate
4.1%
Mortgage Type
VA
Purchase Details
Closed on
Apr 30, 2013
Sold by
Pinkston Bralie S
Bought by
Brown Bralie Pinkston and Brown Anthony
Purchase Details
Closed on
Oct 29, 2010
Sold by
Pinkston Bralie S
Bought by
Pinkston Bralie S
Purchase Details
Closed on
May 20, 2008
Sold by
Pinkston Debra
Bought by
Pinkston Bralie S
Purchase Details
Closed on
Mar 28, 2005
Sold by
Pinkston Debra Roseann
Bought by
Pinkston Bralie and Pinkston Debra
Home Financials for this Owner
Home Financials are based on the most recent Mortgage that was taken out on this home.
Original Mortgage
$350,000
Interest Rate
5.75%
Mortgage Type
Purchase Money Mortgage
Purchase Details
Closed on
Sep 7, 1995
Sold by
Berry Ellen Louise
Bought by
Pinkston Debra Roseann
Purchase Details
Closed on
May 10, 1994
Sold by
Westover Roland R
Bought by
Berry Ellen Louise
Home Financials for this Owner
Home Financials are based on the most recent Mortgage that was taken out on this home.
Original Mortgage
$88,200
Interest Rate
8.6%
Purchase Details
Closed on
Apr 1, 1987
Create a Home Valuation Report for This Property
The Home Valuation Report is an in-depth analysis detailing your home's value as well as a comparison with similar homes in the area
Home Values in the Area
Average Home Value in this Area
Purchase History
| Date | Buyer | Sale Price | Title Company |
|---|---|---|---|
| Pinkston-Brown Bralie | -- | None Listed On Document | |
| Bralie S Pinkston Living Trust | -- | None Listed On Document | |
| Pinkston-Brown Bralie | -- | None Listed On Document | |
| Pinkston-Brown Bralie | -- | None Listed On Document | |
| Bralie S Pinkston Living Trust | -- | -- | |
| Pinkston-Brown Bralie | -- | -- | |
| Brown Bralie Pinkston | -- | Lawyers Title Sd | |
| Brown Anthony | -- | Lawyers Title Sd | |
| Brown Bralie Pinkston | -- | None Available | |
| Pinkston Bralie S | -- | None Available | |
| Pinkston Bralie S | -- | None Available | |
| Pinkston Bralie | -- | First American Title | |
| Pinkston Debra Roseann | -- | -- | |
| Berry Ellen Louise | $126,000 | Union Land Title Co | |
| -- | $85,000 | -- |
Source: Public Records
Mortgage History
| Date | Status | Borrower | Loan Amount |
|---|---|---|---|
| Open | Pinkston-Brown Bralie | $60,000 | |
| Closed | Pinkston-Brown Bralie | $60,000 | |
| Closed | Pinkston-Brown Bralie | $60,000 | |
| Previous Owner | Brown Anthony | $400,000 | |
| Previous Owner | Pinkston Bralie | $350,000 | |
| Previous Owner | Berry Ellen Louise | $88,200 |
Source: Public Records
Tax History Compared to Growth
Tax History
| Year | Tax Paid | Tax Assessment Tax Assessment Total Assessment is a certain percentage of the fair market value that is determined by local assessors to be the total taxable value of land and additions on the property. | Land | Improvement |
|---|---|---|---|---|
| 2025 | $2,527 | $214,124 | $86,803 | $127,321 |
| 2024 | $2,527 | $209,926 | $85,101 | $124,825 |
| 2023 | $2,469 | $205,811 | $83,433 | $122,378 |
| 2022 | $663 | $201,777 | $81,798 | $119,979 |
| 2021 | $652 | $197,822 | $80,195 | $117,627 |
| 2020 | $679 | $195,794 | $79,373 | $116,421 |
| 2019 | $680 | $191,956 | $77,817 | $114,139 |
| 2018 | $4,683 | $188,193 | $76,292 | $111,901 |
| 2017 | $80 | $184,504 | $74,797 | $109,707 |
| 2016 | $6,176 | $180,887 | $73,331 | $107,556 |
| 2015 | $2,122 | $178,171 | $72,230 | $105,941 |
| 2014 | $2,090 | $174,682 | $70,816 | $103,866 |
Source: Public Records
Map
Nearby Homes
- 5359 Caminito Mindy
- 5233 Caminito Cachorro
- 2503 2501 Sumac Dr
- 3326 & 3330 40th St
- 0 Redwood St Unit IG25200939
- 5468 Chollas Station Rd
- 2215 Susan Place
- 4918 Dalehaven Place
- 3566 51st St
- 4769 Thorn St
- 2872 47th St
- 4712 Home Ave
- 4666 Home Ave Unit 68
- 5474 Streamview Dr
- 3416 Winlow St
- 5550 Grape St
- 5011 Auburn Dr
- 5426 Dwight St
- 4787 Dwight St
- 3518-3520 Euclid Ave E
- 5191 Krenning St
- 5151 Krenning St
- 5160 Palm St
- 5170 Palm St
- 5142 Palm St
- 5131 Krenning St
- 2942 Collura St
- 5130 Krenning St
- 5132 Palm St
- 2921 Collura St
- 2901 Collura St Unit 2
- 2952 Collura St
- 2971 51st St
- 2941 51st St
- 5161 Palm St
- 5151 Palm St
- 5171 Palm St
- 5202 Krenning St
- 5211 Krenning St
- 5141 Palm St