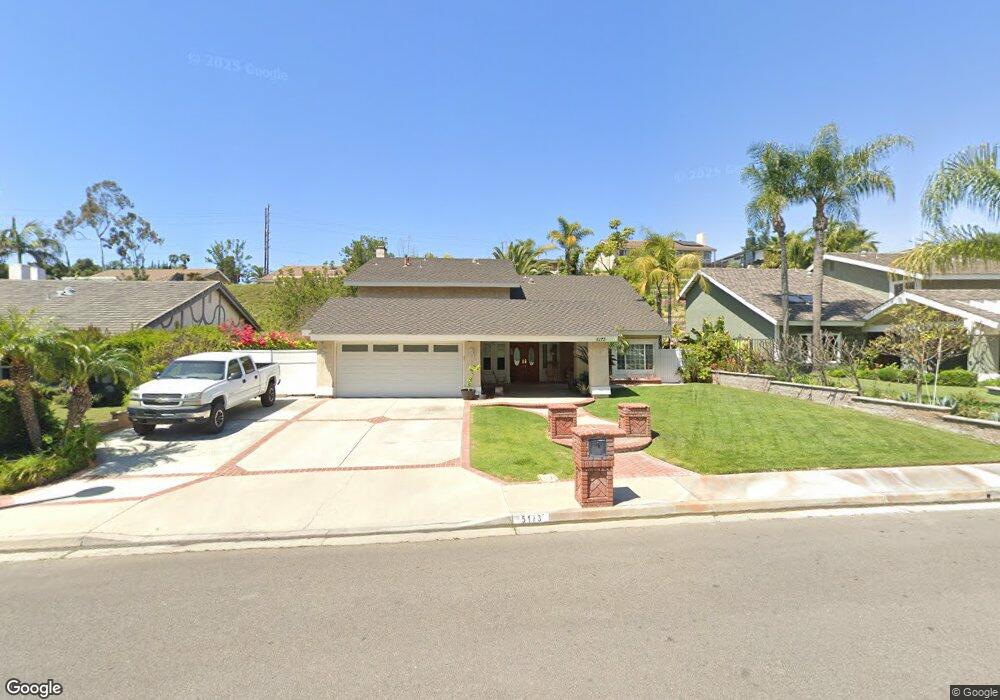
5173 Lupine St Yorba Linda, CA 92886
Estimated Value: $1,597,000 - $1,723,207
5
Beds
3
Baths
3,055
Sq Ft
$548/Sq Ft
Est. Value
About This Home
This home is located at 5173 Lupine St, Yorba Linda, CA 92886 and is currently estimated at $1,672,802, approximately $547 per square foot. 5173 Lupine St is a home located in Orange County with nearby schools including Fairmont Elementary, Bernardo Yorba Middle School, and Friends Christian School.
Ownership History
Date
Name
Owned For
Owner Type
Purchase Details
Closed on
Sep 26, 2023
Sold by
Cadiz Andrew and Cadiz Debra
Bought by
Andrew Cadiz And Debra Lynne Trust and Cadiz
Current Estimated Value
Purchase Details
Closed on
Oct 6, 2011
Sold by
Cadiz Andrew
Bought by
Cadiz Andrew and Cadiz Debra
Home Financials for this Owner
Home Financials are based on the most recent Mortgage that was taken out on this home.
Original Mortgage
$448,000
Interest Rate
4.05%
Mortgage Type
New Conventional
Purchase Details
Closed on
Aug 6, 2001
Sold by
Vanwinkle Ronald James and Vanwinkle Dolores Bridget
Bought by
Cadiz Andrew and Cadiz Debra
Home Financials for this Owner
Home Financials are based on the most recent Mortgage that was taken out on this home.
Original Mortgage
$275,000
Interest Rate
7.09%
Create a Home Valuation Report for This Property
The Home Valuation Report is an in-depth analysis detailing your home's value as well as a comparison with similar homes in the area
Home Values in the Area
Average Home Value in this Area
Purchase History
| Date | Buyer | Sale Price | Title Company |
|---|---|---|---|
| Andrew Cadiz And Debra Lynne Trust | -- | None Listed On Document | |
| Cadiz Andrew | -- | First American Title Company | |
| Cadiz Andrew | -- | First American Title Company | |
| Cadiz Andrew | $428,000 | Equity Title |
Source: Public Records
Mortgage History
| Date | Status | Borrower | Loan Amount |
|---|---|---|---|
| Previous Owner | Cadiz Andrew | $448,000 | |
| Previous Owner | Cadiz Andrew | $275,000 | |
| Closed | Cadiz Andrew | $57,400 |
Source: Public Records
Tax History Compared to Growth
Tax History
| Year | Tax Paid | Tax Assessment Tax Assessment Total Assessment is a certain percentage of the fair market value that is determined by local assessors to be the total taxable value of land and additions on the property. | Land | Improvement |
|---|---|---|---|---|
| 2025 | $8,085 | $724,468 | $402,543 | $321,925 |
| 2024 | $8,085 | $710,263 | $394,650 | $315,613 |
| 2023 | $7,940 | $696,337 | $386,912 | $309,425 |
| 2022 | $7,849 | $682,684 | $379,326 | $303,358 |
| 2021 | $7,723 | $669,299 | $371,889 | $297,410 |
| 2020 | $7,629 | $662,437 | $368,076 | $294,361 |
| 2019 | $7,357 | $649,449 | $360,859 | $288,590 |
| 2018 | $7,265 | $636,715 | $353,783 | $282,932 |
| 2017 | $7,146 | $624,231 | $346,846 | $277,385 |
| 2016 | $7,002 | $611,992 | $340,045 | $271,947 |
| 2015 | $6,916 | $602,800 | $334,937 | $267,863 |
| 2014 | $6,711 | $590,992 | $328,376 | $262,616 |
Source: Public Records
Map
Nearby Homes
- 19831 Caprice Dr
- 19862 Le Mans Cir
- 19841 Lombardy Ln
- 20361 Via Juana
- 91 VAC/COR E Avenue L
- 4774 Serrente Plaza
- 19762 Ridgewood Place
- 4545 Avenida Rio Del Oro
- 4741 Cardena Plaza
- 5540 Via Sara
- 4446 Avenida de Las Flores
- 20455 Via Cadiz
- 4418 Avenida Del Este
- 5312 Kentwater Place
- 4362 Via Alegre
- 19701 Parkview Terrace
- 5031 Fairway View Dr
- 19426 Via Del Caballo
- 20100 Livorno Ln
- 5505 Calle Vista Linda
- 5183 Lupine St
- 5153 Lupine St
- 5156 Felicia Dr
- 5133 Lupine St
- 5176 Felicia Dr
- 5136 Felicia Dr
- 5193 Lupine St
- 5186 Felicia Dr
- 5176 Lupine St
- 5086 Felicia Dr
- 5156 Lupine St
- 5113 Lupine St
- 5186 Lupine St
- 5146 Lupine St
- 5196 Lupine St
- 5066 Felicia Dr
- 5093 Aster Ln
- 5073 Aster Ln
- 5213 Lupine St
- 5216 Lupine St