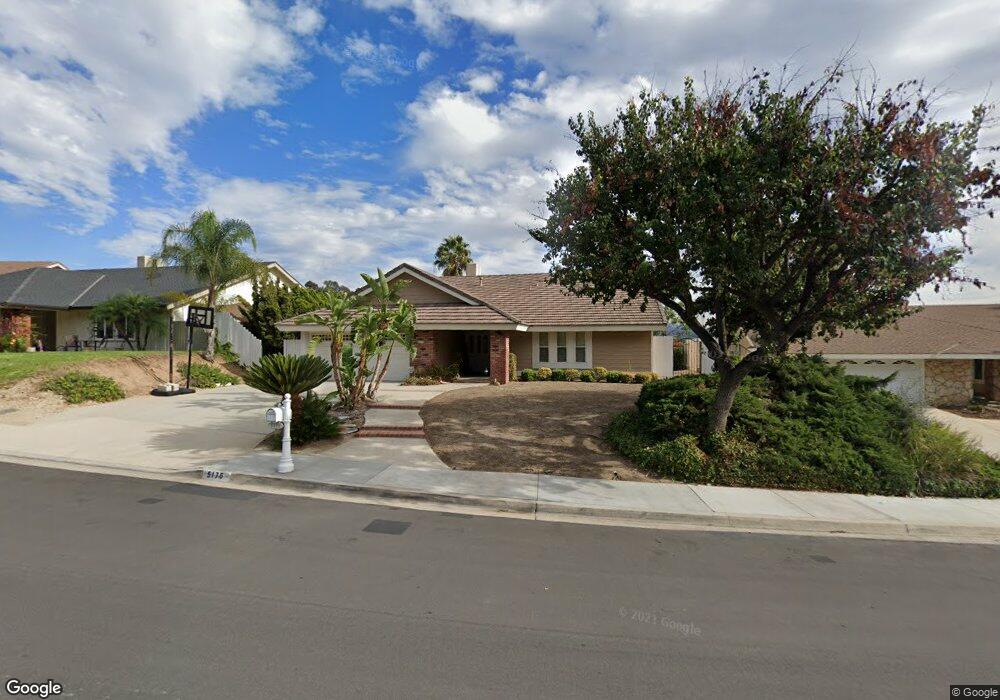
5176 Felicia Dr Yorba Linda, CA 92886
Estimated Value: $1,370,368 - $1,553,000
4
Beds
2
Baths
2,176
Sq Ft
$672/Sq Ft
Est. Value
About This Home
This home is located at 5176 Felicia Dr, Yorba Linda, CA 92886 and is currently estimated at $1,462,092, approximately $671 per square foot. 5176 Felicia Dr is a home located in Orange County with nearby schools including Fairmont Elementary, Bernardo Yorba Middle School, and Friends Christian School.
Ownership History
Date
Name
Owned For
Owner Type
Purchase Details
Closed on
Apr 4, 2023
Sold by
Hemmerling Alicia M
Bought by
Alicia M Hemmerling Revocable Trust and Hemmerling
Current Estimated Value
Purchase Details
Closed on
Feb 12, 2021
Sold by
Hemmerling Alicia M
Bought by
Hemmerling Alicia M
Home Financials for this Owner
Home Financials are based on the most recent Mortgage that was taken out on this home.
Original Mortgage
$382,600
Interest Rate
2.73%
Mortgage Type
New Conventional
Purchase Details
Closed on
Mar 16, 2007
Sold by
Hemmerling Bruce R
Bought by
Hemmerling Alicia M
Purchase Details
Closed on
Jul 6, 1998
Sold by
Hemmerling Bruce R J
Bought by
Hemmerling Bruce R and Hammerling Alicica M
Home Financials for this Owner
Home Financials are based on the most recent Mortgage that was taken out on this home.
Original Mortgage
$195,000
Interest Rate
6.9%
Create a Home Valuation Report for This Property
The Home Valuation Report is an in-depth analysis detailing your home's value as well as a comparison with similar homes in the area
Home Values in the Area
Average Home Value in this Area
Purchase History
| Date | Buyer | Sale Price | Title Company |
|---|---|---|---|
| Alicia M Hemmerling Revocable Trust | -- | None Listed On Document | |
| Hemmerling Alicia M | -- | Title365 | |
| Hemmerling Alicia M | -- | Ticor Title Company Brea | |
| Hemmerling Bruce R | -- | Fidelity National Title Co |
Source: Public Records
Mortgage History
| Date | Status | Borrower | Loan Amount |
|---|---|---|---|
| Previous Owner | Hemmerling Alicia M | $382,600 | |
| Previous Owner | Hemmerling Bruce R | $195,000 |
Source: Public Records
Tax History Compared to Growth
Tax History
| Year | Tax Paid | Tax Assessment Tax Assessment Total Assessment is a certain percentage of the fair market value that is determined by local assessors to be the total taxable value of land and additions on the property. | Land | Improvement |
|---|---|---|---|---|
| 2025 | $5,475 | $472,953 | $247,131 | $225,822 |
| 2024 | $5,475 | $463,680 | $242,285 | $221,395 |
| 2023 | $5,371 | $454,589 | $237,535 | $217,054 |
| 2022 | $5,294 | $445,676 | $232,877 | $212,799 |
| 2021 | $5,211 | $436,938 | $228,311 | $208,627 |
| 2020 | $5,109 | $432,458 | $225,970 | $206,488 |
| 2019 | $4,931 | $423,979 | $221,539 | $202,440 |
| 2018 | $4,868 | $415,666 | $217,195 | $198,471 |
| 2017 | $4,788 | $407,516 | $212,936 | $194,580 |
| 2016 | $4,692 | $399,526 | $208,761 | $190,765 |
| 2015 | $4,634 | $393,525 | $205,625 | $187,900 |
| 2014 | $4,497 | $385,817 | $201,597 | $184,220 |
Source: Public Records
Map
Nearby Homes
- 19831 Caprice Dr
- 19862 Le Mans Cir
- 19841 Lombardy Ln
- 20361 Via Juana
- 91 VAC/COR E Avenue L
- 4774 Serrente Plaza
- 19762 Ridgewood Place
- 4545 Avenida Rio Del Oro
- 4741 Cardena Plaza
- 5540 Via Sara
- 4446 Avenida de Las Flores
- 5312 Kentwater Place
- 20455 Via Cadiz
- 19701 Parkview Terrace
- 4418 Avenida Del Este
- 4362 Via Alegre
- 5031 Fairway View Dr
- 20100 Livorno Ln
- 19072 Lamplight Ln
- 5245 Grandview Ave
- 5156 Felicia Dr
- 5186 Felicia Dr
- 5183 Lupine St
- 5136 Felicia Dr
- 5173 Lupine St
- 5193 Lupine St
- 5153 Lupine St
- 5086 Felicia Dr
- 5133 Lupine St
- 19861 Villager Cir
- 19862 Villager Cir
- 5063 Felicia Dr
- 5066 Felicia Dr
- 5213 Lupine St
- 19866 Caprice Dr
- 5113 Lupine St
- 5186 Lupine St
- 5176 Lupine St
- 19841 Villager Cir
- 5196 Lupine St