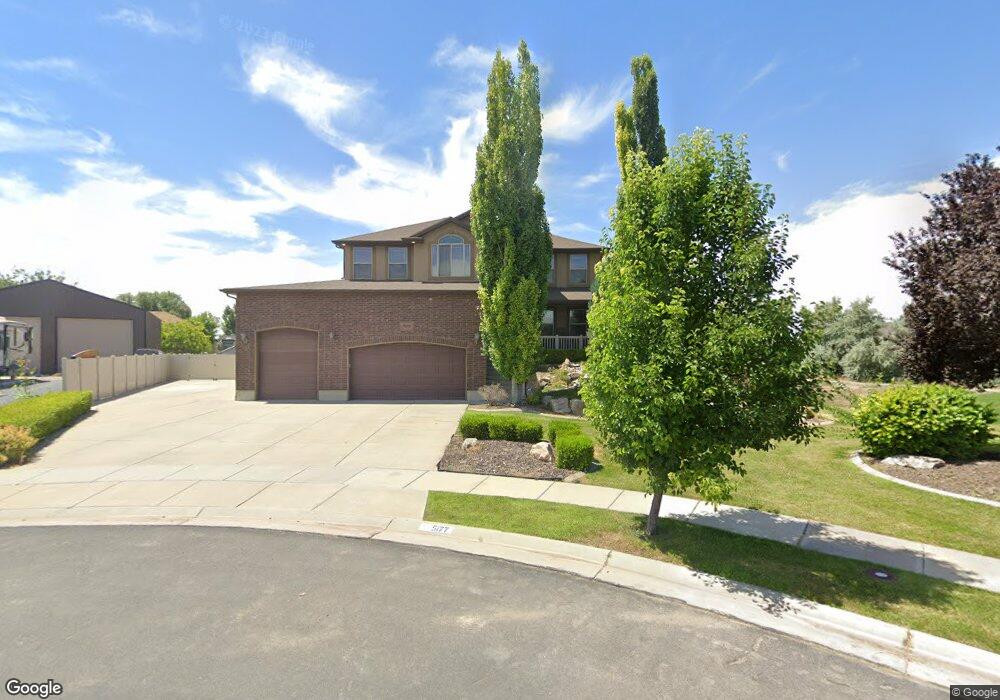
5177 S 5750 W Hooper, UT 84315
Estimated Value: $701,204 - $754,000
5
Beds
3
Baths
3,350
Sq Ft
$217/Sq Ft
Est. Value
About This Home
This home is located at 5177 S 5750 W, Hooper, UT 84315 and is currently estimated at $728,051, approximately $217 per square foot. 5177 S 5750 W is a home located in Weber County with nearby schools including Hooper Elementary School, Rocky Mountain Junior High School, and Fremont High School.
Ownership History
Date
Name
Owned For
Owner Type
Purchase Details
Closed on
Dec 27, 2017
Sold by
Flynn Tara S
Bought by
Horspool Kyle J and The Kyle J Horspool Trust
Current Estimated Value
Purchase Details
Closed on
Jun 3, 2016
Bought by
Flynn Tara Suarez
Home Financials for this Owner
Home Financials are based on the most recent Mortgage that was taken out on this home.
Original Mortgage
$369,550
Interest Rate
3.66%
Purchase Details
Closed on
May 21, 2009
Sold by
Castle Creek Homes Llc
Bought by
Platt Nathan A and Platt Joni A
Home Financials for this Owner
Home Financials are based on the most recent Mortgage that was taken out on this home.
Original Mortgage
$302,355
Interest Rate
4.82%
Mortgage Type
FHA
Purchase Details
Closed on
Dec 19, 2008
Sold by
Lakeview Farms 1 Llc
Bought by
Platt Nathan
Create a Home Valuation Report for This Property
The Home Valuation Report is an in-depth analysis detailing your home's value as well as a comparison with similar homes in the area
Home Values in the Area
Average Home Value in this Area
Purchase History
| Date | Buyer | Sale Price | Title Company |
|---|---|---|---|
| Horspool Kyle J | -- | None Available | |
| Flynn Tara Suarez | -- | -- | |
| Platt Nathan A | -- | Mountain View Title Ogden | |
| Platt Nathan A | -- | Mountain View Title Ogden | |
| Platt Nathan | -- | Mountain View Title Ogden |
Source: Public Records
Mortgage History
| Date | Status | Borrower | Loan Amount |
|---|---|---|---|
| Previous Owner | Flynn Tara Suarez | $369,550 | |
| Previous Owner | Flynn Tara Suarez | -- | |
| Previous Owner | Platt Nathan A | $302,355 | |
| Closed | Platt Nathan | $0 |
Source: Public Records
Tax History Compared to Growth
Tax History
| Year | Tax Paid | Tax Assessment Tax Assessment Total Assessment is a certain percentage of the fair market value that is determined by local assessors to be the total taxable value of land and additions on the property. | Land | Improvement |
|---|---|---|---|---|
| 2025 | $3,794 | $661,664 | $226,877 | $434,787 |
| 2024 | $3,655 | $356,949 | $124,782 | $232,167 |
| 2023 | $3,881 | $375,650 | $124,562 | $251,088 |
| 2022 | $3,589 | $355,300 | $99,553 | $255,747 |
| 2021 | $3,230 | $539,000 | $116,050 | $422,950 |
| 2020 | $2,990 | $457,000 | $101,002 | $355,998 |
| 2019 | $2,954 | $427,000 | $90,775 | $336,225 |
| 2018 | $2,959 | $409,000 | $80,710 | $328,290 |
| 2017 | $2,704 | $362,000 | $80,632 | $281,368 |
| 2016 | $2,605 | $188,263 | $38,422 | $149,841 |
| 2015 | $2,549 | $181,530 | $38,824 | $142,706 |
| 2014 | $2,367 | $164,005 | $38,824 | $125,181 |
Source: Public Records
Map
Nearby Homes
- 6014 W 5300 S
- 0 W 5500 S
- 5947 W 4600 S
- 3729 S 5600 W Unit 6
- 3720 S 5600 W Unit 2
- 3719 S 5600 W Unit 7
- 6036 W 4700 S
- 5335 W 5500 S
- 3632 S 5400 W
- 4879 S 5050 W
- 4146 S 5800 W Unit 5
- 4163 S 5800 W Unit 2
- 3191 S 5100 St W Unit 1
- 4931 S 4700 W
- 4909 W 5850 S
- 4111 S 5350 W
- 4700 W 5500 S
- 4556 W 4950 S
- 5752 W 2425 N
- 4632 W 5750 S
- 5185 S 5750 W
- 5176 S 5825 W
- 5197 S 5750 W Unit 44
- 5184 S 5825 W
- 5186 S 5750 W
- 5194 S 5825 W
- 5731 W 4100 S
- 4115 S 5800 W
- 5721 W 4100 S
- 5777 W 4100 S
- 5712 W 4100 S
- 4097 S 5800 W Unit 114
- 5731 W 4100 S Unit 108
- 4027 S 5725 W Unit 119
- 4012 S 5725 W Unit 100
- 5722 W 4100 S Unit 104
- 4073 S 5725 W Unit 118
- 5196 S 5750 W
- 5145 S 5725 W
- 5175 S 5825 W