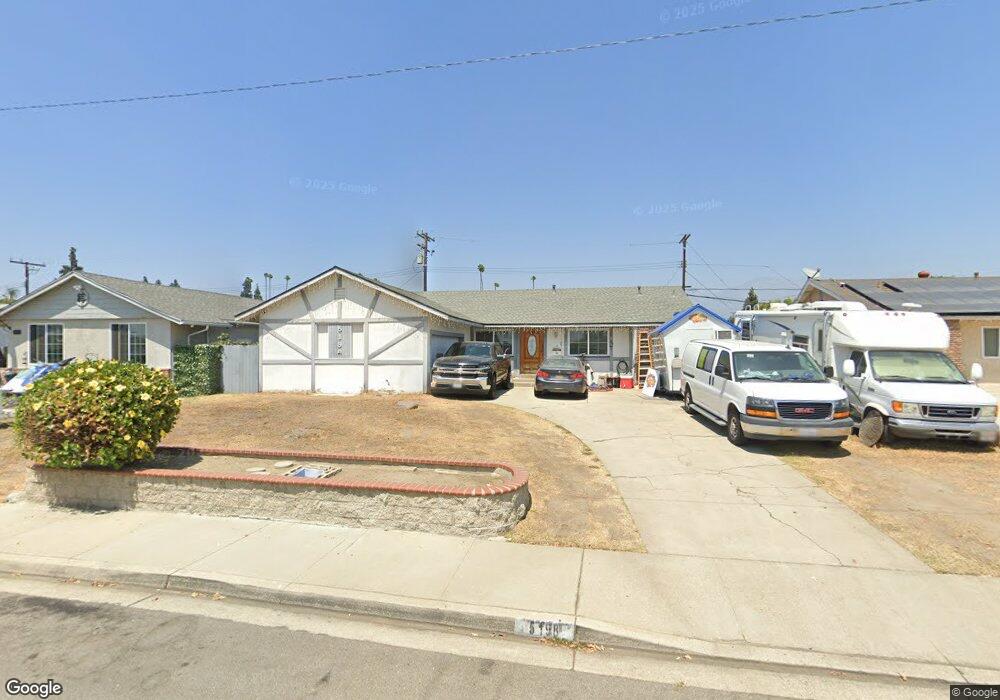
5198 El Morado St Montclair, CA 91763
Estimated Value: $633,680 - $723,000
3
Beds
2
Baths
1,416
Sq Ft
$488/Sq Ft
Est. Value
About This Home
This home is located at 5198 El Morado St, Montclair, CA 91763 and is currently estimated at $691,420, approximately $488 per square foot. 5198 El Morado St is a home located in San Bernardino County with nearby schools including Monte Vista Elementary School, Serrano Middle School, and Montclair High School.
Ownership History
Date
Name
Owned For
Owner Type
Purchase Details
Closed on
Dec 15, 2020
Sold by
Tang Don
Bought by
D & T Homes Llc
Current Estimated Value
Home Financials for this Owner
Home Financials are based on the most recent Mortgage that was taken out on this home.
Original Mortgage
$328,000
Outstanding Balance
$292,018
Interest Rate
2.7%
Mortgage Type
New Conventional
Estimated Equity
$399,402
Purchase Details
Closed on
Aug 27, 2018
Sold by
Tang Don
Bought by
D & T Homes Llc
Purchase Details
Closed on
Jan 30, 2018
Sold by
Tang Don
Bought by
Tang Don and Don Tang Revocable Trust
Purchase Details
Closed on
Jun 4, 2013
Sold by
Tang Don
Bought by
Tang Don
Home Financials for this Owner
Home Financials are based on the most recent Mortgage that was taken out on this home.
Original Mortgage
$204,000
Interest Rate
3.37%
Mortgage Type
New Conventional
Purchase Details
Closed on
May 2, 2013
Sold by
Tang Kathleen
Bought by
Tang Don and Hang Lisa
Home Financials for this Owner
Home Financials are based on the most recent Mortgage that was taken out on this home.
Original Mortgage
$204,000
Interest Rate
3.37%
Mortgage Type
New Conventional
Purchase Details
Closed on
Apr 26, 2013
Sold by
Hughes Sean M
Bought by
Tang Kathleen
Home Financials for this Owner
Home Financials are based on the most recent Mortgage that was taken out on this home.
Original Mortgage
$204,000
Interest Rate
3.37%
Mortgage Type
New Conventional
Purchase Details
Closed on
Apr 16, 2013
Sold by
Hang Lisa
Bought by
Tang Don
Home Financials for this Owner
Home Financials are based on the most recent Mortgage that was taken out on this home.
Original Mortgage
$204,000
Interest Rate
3.37%
Mortgage Type
New Conventional
Purchase Details
Closed on
Sep 16, 2011
Sold by
Tang Kathleen
Bought by
Tang Don and Hang Lisa
Purchase Details
Closed on
May 23, 2007
Sold by
Tang Kathleen
Bought by
Tang Kathleen and Hang Lisa
Purchase Details
Closed on
Jun 26, 2001
Sold by
An Hang Cac
Bought by
Tang Kathleen
Purchase Details
Closed on
Apr 4, 1997
Sold by
Federal National Mortgage Association
Bought by
An Hang Cac
Home Financials for this Owner
Home Financials are based on the most recent Mortgage that was taken out on this home.
Original Mortgage
$84,000
Interest Rate
7.96%
Mortgage Type
Seller Take Back
Purchase Details
Closed on
Jan 13, 1997
Sold by
Ma Garcia Sylvia Marie
Bought by
Federal National Mortgage Association
Purchase Details
Closed on
May 29, 1996
Sold by
Hernandez Ernesto
Bought by
Garcia Sylvia Marie
Create a Home Valuation Report for This Property
The Home Valuation Report is an in-depth analysis detailing your home's value as well as a comparison with similar homes in the area
Home Values in the Area
Average Home Value in this Area
Purchase History
| Date | Buyer | Sale Price | Title Company |
|---|---|---|---|
| D & T Homes Llc | -- | Ticor Title Company Of Ca | |
| Tang Don | -- | Ticor Title Company Of Ca | |
| D & T Homes Llc | -- | Accommodation | |
| Tang Don | -- | None Available | |
| Tang Don | -- | First American | |
| Tang Don | -- | First American | |
| Tang Kathleen | -- | First American | |
| Tang Don | -- | None Available | |
| Tang Don | -- | None Available | |
| Tang Don | -- | None Available | |
| Tang Kathleen | -- | None Available | |
| Tang Kathleen | -- | United Title Company | |
| An Hang Cac | $105,000 | Fidelity National Title Ins | |
| Federal National Mortgage Association | $137,589 | American Title Co | |
| Garcia Sylvia Marie | -- | -- |
Source: Public Records
Mortgage History
| Date | Status | Borrower | Loan Amount |
|---|---|---|---|
| Open | Tang Don | $328,000 | |
| Previous Owner | Tang Don | $204,000 | |
| Previous Owner | An Hang Cac | $84,000 |
Source: Public Records
Tax History Compared to Growth
Tax History
| Year | Tax Paid | Tax Assessment Tax Assessment Total Assessment is a certain percentage of the fair market value that is determined by local assessors to be the total taxable value of land and additions on the property. | Land | Improvement |
|---|---|---|---|---|
| 2025 | $3,070 | $284,793 | $124,423 | $160,370 |
| 2024 | $3,070 | $279,208 | $121,983 | $157,225 |
| 2023 | $2,984 | $273,733 | $119,591 | $154,142 |
| 2022 | $2,944 | $268,366 | $117,246 | $151,120 |
| 2021 | $2,926 | $263,104 | $114,947 | $148,157 |
| 2020 | $2,875 | $260,406 | $113,768 | $146,638 |
| 2019 | $2,850 | $255,300 | $111,537 | $143,763 |
| 2018 | $2,811 | $250,294 | $109,350 | $140,944 |
| 2017 | $2,710 | $245,386 | $107,206 | $138,180 |
| 2016 | $2,603 | $240,575 | $105,104 | $135,471 |
| 2015 | $2,586 | $236,961 | $103,525 | $133,436 |
| 2014 | $2,431 | $232,319 | $101,497 | $130,822 |
Source: Public Records
Map
Nearby Homes
- 10037 Geneva Ave
- 5156 June Mountain Dr
- 9821 Sun Valley Dr
- 9827 Geneva Ave
- 10243 Fremont Ave
- 5141 Aspen Dr
- 5132 Aspen Dr
- 9727 Fremont Ave
- 10279 Marion Ave
- 5135 Taos Dr
- 9966 Vernon Ave
- 4861 Fauna St
- 9932 Santa Anita Ave
- 10593 Mills Ave
- 4861 San Bernardino St
- 4902 Manzanita St
- 827 N Jasmine Ave
- 853 N Jasmine Ave
- 9642 Bolton Ave
- 10199 Camulos Ave
- 5188 El Morado St
- 5208 El Morado St
- 5178 El Morado St
- 5220 El Morado St
- 10040 Carrillo Ave
- 5187 El Morado St
- 5168 El Morado St
- 5177 El Morado St
- 5230 El Morado St
- 10031 Carrillo Ave
- 9996 Poulsen Ave
- 10050 Carrillo Ave
- 5167 El Morado St
- 5156 El Morado St
- 9986 Poulsen Ave
- 5242 El Morado St
- 10047 Carrillo Ave
- 5235 El Morado St
- 10060 Carrillo Ave
- 9976 Poulsen Ave