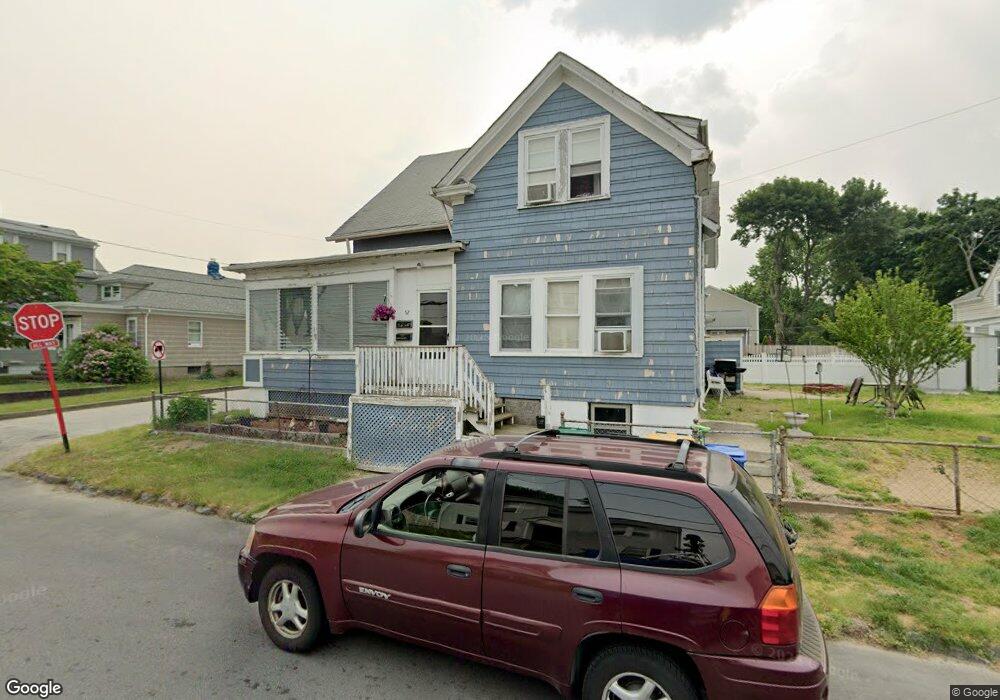
52 Greene Ave Cranston, RI 02920
Knightsville NeighborhoodEstimated Value: $428,151 - $530,000
6
Beds
2
Baths
2,220
Sq Ft
$214/Sq Ft
Est. Value
About This Home
This home is located at 52 Greene Ave, Cranston, RI 02920 and is currently estimated at $474,288, approximately $213 per square foot. 52 Greene Ave is a home located in Providence County with nearby schools including George J. Peters School, Western Hills Middle School, and Cranston High School West.
Ownership History
Date
Name
Owned For
Owner Type
Purchase Details
Closed on
Dec 1, 2004
Sold by
Cabral Caristopher
Bought by
Whited Kenneth
Current Estimated Value
Home Financials for this Owner
Home Financials are based on the most recent Mortgage that was taken out on this home.
Original Mortgage
$220,900
Interest Rate
5.69%
Mortgage Type
Purchase Money Mortgage
Purchase Details
Closed on
Feb 3, 2004
Sold by
Soscia Bruce and Soscia Bryan
Bought by
Cabral Christopher
Create a Home Valuation Report for This Property
The Home Valuation Report is an in-depth analysis detailing your home's value as well as a comparison with similar homes in the area
Home Values in the Area
Average Home Value in this Area
Purchase History
| Date | Buyer | Sale Price | Title Company |
|---|---|---|---|
| Whited Kenneth | $278,500 | -- | |
| Cabral Christopher | $172,000 | -- |
Source: Public Records
Mortgage History
| Date | Status | Borrower | Loan Amount |
|---|---|---|---|
| Open | Cabral Christopher | $284,000 | |
| Closed | Cabral Christopher | $71,000 | |
| Closed | Cabral Christopher | $102,200 | |
| Closed | Cabral Christopher | $220,900 |
Source: Public Records
Tax History Compared to Growth
Tax History
| Year | Tax Paid | Tax Assessment Tax Assessment Total Assessment is a certain percentage of the fair market value that is determined by local assessors to be the total taxable value of land and additions on the property. | Land | Improvement |
|---|---|---|---|---|
| 2025 | $4,660 | $335,700 | $106,900 | $228,800 |
| 2024 | $4,569 | $335,700 | $106,900 | $228,800 |
| 2023 | $4,298 | $227,400 | $70,400 | $157,000 |
| 2022 | $4,209 | $227,400 | $70,400 | $157,000 |
| 2021 | $4,093 | $227,400 | $70,400 | $157,000 |
| 2020 | $4,277 | $205,900 | $67,000 | $138,900 |
| 2019 | $4,277 | $205,900 | $67,000 | $138,900 |
| 2018 | $4,178 | $205,900 | $67,000 | $138,900 |
| 2017 | $3,953 | $172,300 | $60,300 | $112,000 |
| 2016 | $3,868 | $172,300 | $60,300 | $112,000 |
| 2015 | $3,868 | $172,300 | $60,300 | $112,000 |
| 2014 | $3,584 | $156,900 | $60,300 | $96,600 |
Source: Public Records
Map
Nearby Homes