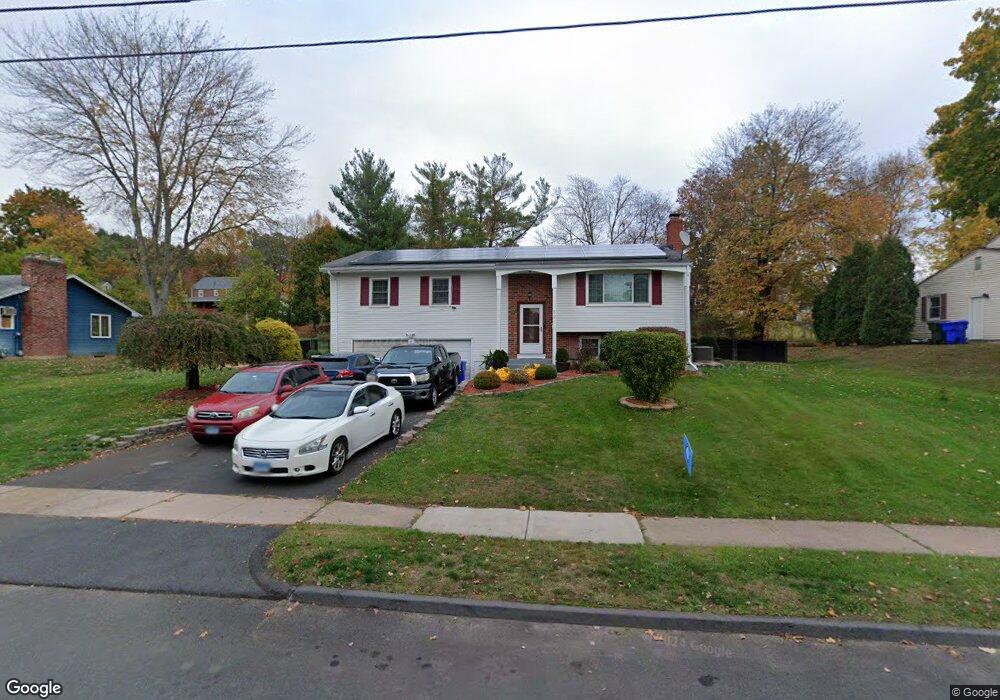
52 Summerset Dr East Hartford, CT 06118
Estimated Value: $356,000 - $387,040
3
Beds
3
Baths
1,280
Sq Ft
$291/Sq Ft
Est. Value
About This Home
This home is located at 52 Summerset Dr, East Hartford, CT 06118 and is currently estimated at $372,260, approximately $290 per square foot. 52 Summerset Dr is a home located in Hartford County with nearby schools including Governor William Pitkin School, East Hartford Middle School, and East Hartford High School.
Ownership History
Date
Name
Owned For
Owner Type
Purchase Details
Closed on
Sep 14, 2011
Sold by
Donnelly Lynne and Macdougall Penelope
Bought by
Mcbean Kenroy A and Mcbean Sophia L
Current Estimated Value
Home Financials for this Owner
Home Financials are based on the most recent Mortgage that was taken out on this home.
Original Mortgage
$190,056
Outstanding Balance
$130,087
Interest Rate
4.25%
Mortgage Type
FHA
Estimated Equity
$242,173
Purchase Details
Closed on
Aug 2, 2004
Sold by
Rios Marisol and Feliciano Juan
Bought by
Donnelly Thomas and Donnelly Lynne
Home Financials for this Owner
Home Financials are based on the most recent Mortgage that was taken out on this home.
Original Mortgage
$176,000
Interest Rate
6.33%
Purchase Details
Closed on
Aug 30, 1993
Sold by
Tedone Lois C
Bought by
Rios Marisol and Felciano Juan
Create a Home Valuation Report for This Property
The Home Valuation Report is an in-depth analysis detailing your home's value as well as a comparison with similar homes in the area
Home Values in the Area
Average Home Value in this Area
Purchase History
| Date | Buyer | Sale Price | Title Company |
|---|---|---|---|
| Mcbean Kenroy A | $195,000 | -- | |
| Donnelly Thomas | $220,000 | -- | |
| Rios Marisol | $137,000 | -- |
Source: Public Records
Mortgage History
| Date | Status | Borrower | Loan Amount |
|---|---|---|---|
| Open | Rios Marisol | $190,056 | |
| Previous Owner | Rios Marisol | $25,000 | |
| Previous Owner | Rios Marisol | $176,000 | |
| Previous Owner | Rios Marisol | $40,000 |
Source: Public Records
Tax History Compared to Growth
Tax History
| Year | Tax Paid | Tax Assessment Tax Assessment Total Assessment is a certain percentage of the fair market value that is determined by local assessors to be the total taxable value of land and additions on the property. | Land | Improvement |
|---|---|---|---|---|
| 2025 | $7,494 | $163,260 | $45,350 | $117,910 |
| 2024 | $7,183 | $163,260 | $45,350 | $117,910 |
| 2023 | $6,945 | $163,260 | $45,350 | $117,910 |
| 2022 | $6,694 | $163,260 | $45,350 | $117,910 |
| 2021 | $6,328 | $128,220 | $34,360 | $93,860 |
| 2020 | $6,401 | $128,220 | $34,360 | $93,860 |
| 2019 | $6,297 | $128,220 | $34,360 | $93,860 |
| 2018 | $5,922 | $124,250 | $34,360 | $89,890 |
| 2017 | $5,846 | $124,250 | $34,360 | $89,890 |
| 2016 | $5,824 | $126,990 | $36,080 | $90,910 |
| 2015 | $5,824 | $126,990 | $36,080 | $90,910 |
| 2014 | $5,765 | $126,990 | $36,080 | $90,910 |
Source: Public Records
Map
Nearby Homes
- 127 Ridgewood Rd
- 334 Forbes St
- 113 Woodlawn Cir
- 95 Arnold Dr
- 6 Judy Dr
- 0 Deborah Dr Unit 115
- 0 Deborah Dr Unit 117 24077631
- 122 Janet Dr
- 49 Deborah Dr Unit 123
- 207 Arnold Dr
- 218 Wakefield Cir Unit 218
- 73 Walnut St
- 4 Gladys Rd
- 90 Christine Dr
- 143R Oak St
- 15 Christine Dr
- 21 Forest Ln
- 8 Howard Ct Unit 10
- 441 Forest St
- 26 Casabella Cir Unit 28
- 60 Summerset Dr
- 55 Summerset Dr
- 44 Summerset Dr
- 47 Summerset Dr
- 68 Summerset Dr
- 63 Summerset Dr
- 74 Summerset Dr
- 36 Summerset Dr
- 39 Summerset Dr
- 71 Summerset Dr
- 93 Ridgewood Rd
- 99 Ridgewood Rd
- 65 Westview Dr
- 105 Ridgewood Rd
- 125 Sawka Dr
- 111 Ridgewood Rd
- 31 Summerset Dr
- 57 Westview Dr
- 28 Summerset Dr
- 131 Sawka Dr