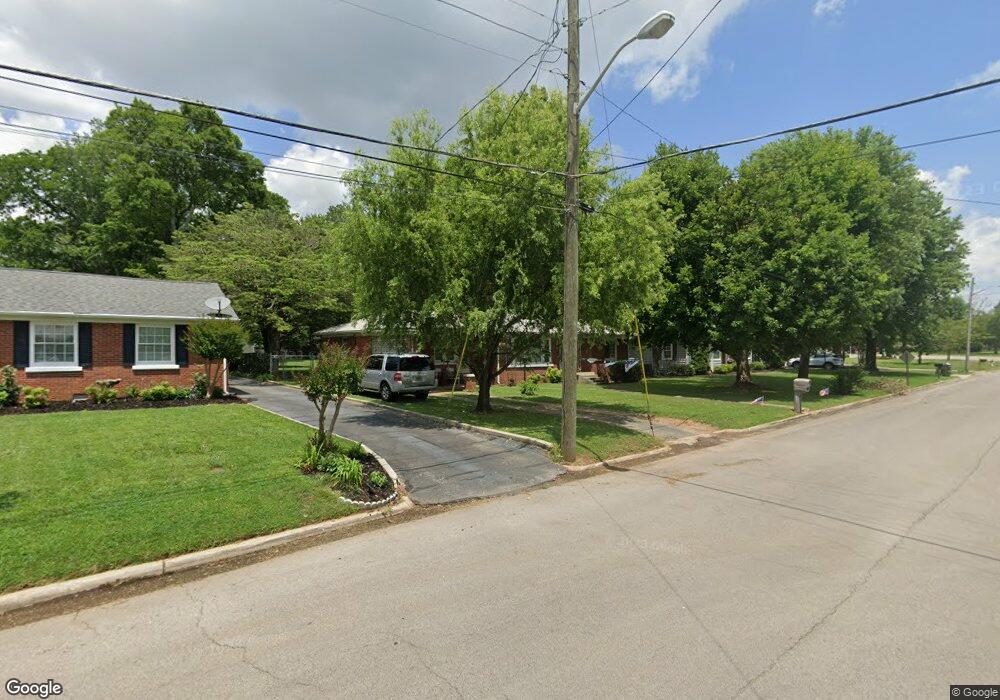
520 1st St Lawrenceburg, TN 38464
Estimated Value: $151,000 - $229,000
--
Bed
1
Bath
1,282
Sq Ft
$143/Sq Ft
Est. Value
About This Home
This home is located at 520 1st St, Lawrenceburg, TN 38464 and is currently estimated at $183,086, approximately $142 per square foot. 520 1st St is a home located in Lawrence County with nearby schools including Ingram Sowell Elementary School, Lawrenceburg Public Elementary School, and David Crockett Elementary School.
Ownership History
Date
Name
Owned For
Owner Type
Purchase Details
Closed on
Sep 8, 2004
Sold by
Whitfield Perkins
Bought by
Coyce Beecham Terrell
Current Estimated Value
Purchase Details
Closed on
Feb 10, 2004
Sold by
Tice Max E
Bought by
Whitfield Perkins
Purchase Details
Closed on
Dec 4, 1997
Sold by
Dixie Wright
Bought by
Max Tice
Purchase Details
Closed on
Apr 24, 1997
Sold by
Jim Wright
Bought by
David Morphew
Purchase Details
Closed on
Aug 3, 1977
Bought by
Wright Jim
Create a Home Valuation Report for This Property
The Home Valuation Report is an in-depth analysis detailing your home's value as well as a comparison with similar homes in the area
Home Values in the Area
Average Home Value in this Area
Purchase History
| Date | Buyer | Sale Price | Title Company |
|---|---|---|---|
| Coyce Beecham Terrell | $55,000 | -- | |
| Whitfield Perkins | $53,000 | -- | |
| Max Tice | $52,000 | -- | |
| David Morphew | $48,000 | -- | |
| Dixie Wright | $8,000 | -- | |
| Wright Jim | -- | -- |
Source: Public Records
Tax History Compared to Growth
Tax History
| Year | Tax Paid | Tax Assessment Tax Assessment Total Assessment is a certain percentage of the fair market value that is determined by local assessors to be the total taxable value of land and additions on the property. | Land | Improvement |
|---|---|---|---|---|
| 2025 | $883 | $28,400 | $0 | $0 |
| 2024 | $883 | $28,400 | $2,500 | $25,900 |
| 2023 | $883 | $28,400 | $2,500 | $25,900 |
| 2022 | $883 | $28,400 | $2,500 | $25,900 |
| 2021 | $617 | $14,025 | $2,500 | $11,525 |
| 2020 | $617 | $14,025 | $2,500 | $11,525 |
| 2019 | $617 | $14,025 | $2,500 | $11,525 |
| 2018 | $617 | $14,025 | $2,500 | $11,525 |
| 2017 | $617 | $14,025 | $2,500 | $11,525 |
| 2016 | $617 | $14,025 | $2,500 | $11,525 |
| 2015 | $584 | $14,025 | $2,500 | $11,525 |
| 2014 | $607 | $14,575 | $2,500 | $12,075 |
Source: Public Records
Map
Nearby Homes