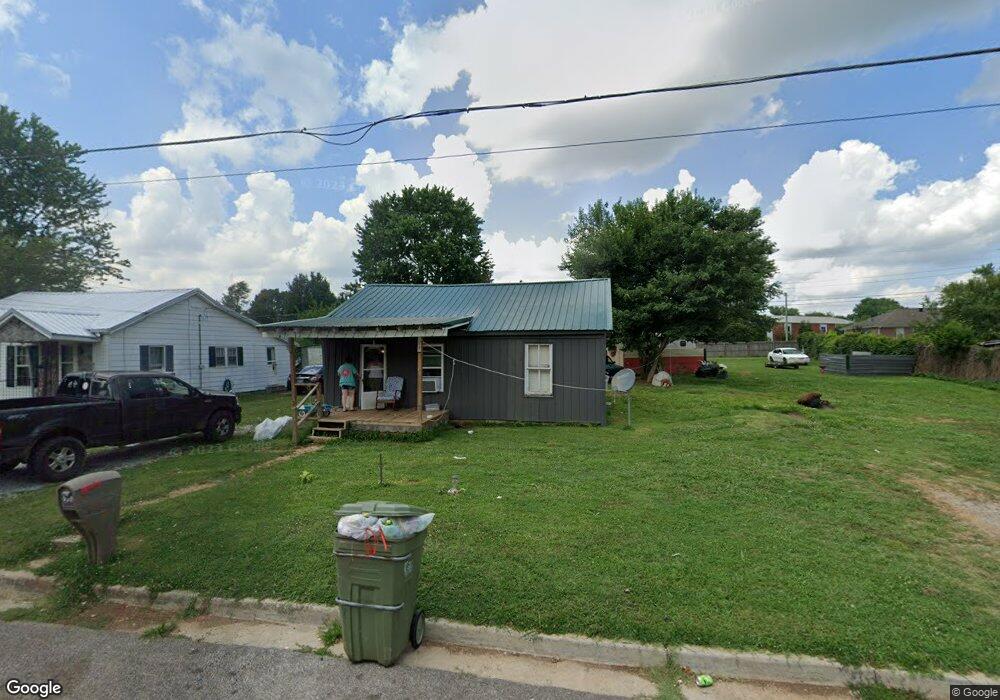
520 6th St Lawrenceburg, TN 38464
Estimated Value: $43,000 - $128,000
--
Bed
1
Bath
672
Sq Ft
$122/Sq Ft
Est. Value
About This Home
This home is located at 520 6th St, Lawrenceburg, TN 38464 and is currently estimated at $82,078, approximately $122 per square foot. 520 6th St is a home located in Lawrence County with nearby schools including Ingram Sowell Elementary School, Lawrenceburg Public Elementary School, and David Crockett Elementary School.
Ownership History
Date
Name
Owned For
Owner Type
Purchase Details
Closed on
Oct 11, 2022
Sold by
Wheeley Brent
Bought by
Wheeley Brent and Wheeley Sandy
Current Estimated Value
Home Financials for this Owner
Home Financials are based on the most recent Mortgage that was taken out on this home.
Original Mortgage
$1,520,000
Outstanding Balance
$1,460,687
Interest Rate
6.02%
Mortgage Type
New Conventional
Estimated Equity
-$1,378,609
Purchase Details
Closed on
Feb 17, 2022
Sold by
Marie Woodard Jennifer and Marie Randall
Bought by
Wheeley Brent and Bonner Rodney
Purchase Details
Closed on
Mar 8, 2021
Sold by
Woodard Jennifer Marie
Bought by
Woodard Jennifer Marie and Summers Randall
Purchase Details
Closed on
May 1, 2019
Sold by
Orton Rual
Bought by
Wodard Willis Wayne and Wodard Jennifer Marie
Purchase Details
Closed on
Jan 11, 1995
Sold by
Peppers H V
Bought by
Rual Orton
Purchase Details
Closed on
Jun 12, 1981
Bought by
Peppers H V
Purchase Details
Closed on
Jan 1, 1981
Create a Home Valuation Report for This Property
The Home Valuation Report is an in-depth analysis detailing your home's value as well as a comparison with similar homes in the area
Home Values in the Area
Average Home Value in this Area
Purchase History
| Date | Buyer | Sale Price | Title Company |
|---|---|---|---|
| Wheeley Brent | -- | -- | |
| Wheeley Brent | $25,000 | White & Betz | |
| Woodard Jennifer Marie | -- | None Available | |
| Wodard Willis Wayne | $10,000 | None Available | |
| Rual Orton | $14,000 | -- | |
| Peppers H V | -- | -- | |
| -- | $3,500 | -- |
Source: Public Records
Mortgage History
| Date | Status | Borrower | Loan Amount |
|---|---|---|---|
| Open | Wheeley Brent | $1,520,000 |
Source: Public Records
Tax History Compared to Growth
Tax History
| Year | Tax Paid | Tax Assessment Tax Assessment Total Assessment is a certain percentage of the fair market value that is determined by local assessors to be the total taxable value of land and additions on the property. | Land | Improvement |
|---|---|---|---|---|
| 2025 | $178 | $5,700 | $0 | $0 |
| 2024 | $178 | $5,700 | $1,500 | $4,200 |
| 2023 | $178 | $5,700 | $1,500 | $4,200 |
| 2022 | $178 | $5,700 | $1,500 | $4,200 |
| 2021 | $168 | $3,825 | $1,500 | $2,325 |
| 2020 | $168 | $3,825 | $1,500 | $2,325 |
| 2019 | $168 | $3,825 | $1,500 | $2,325 |
| 2018 | $168 | $3,825 | $1,500 | $2,325 |
| 2017 | $168 | $3,825 | $1,500 | $2,325 |
| 2016 | $168 | $3,825 | $1,500 | $2,325 |
| 2015 | $159 | $3,825 | $1,500 | $2,325 |
| 2014 | $153 | $3,675 | $1,500 | $2,175 |
Source: Public Records
Map
Nearby Homes