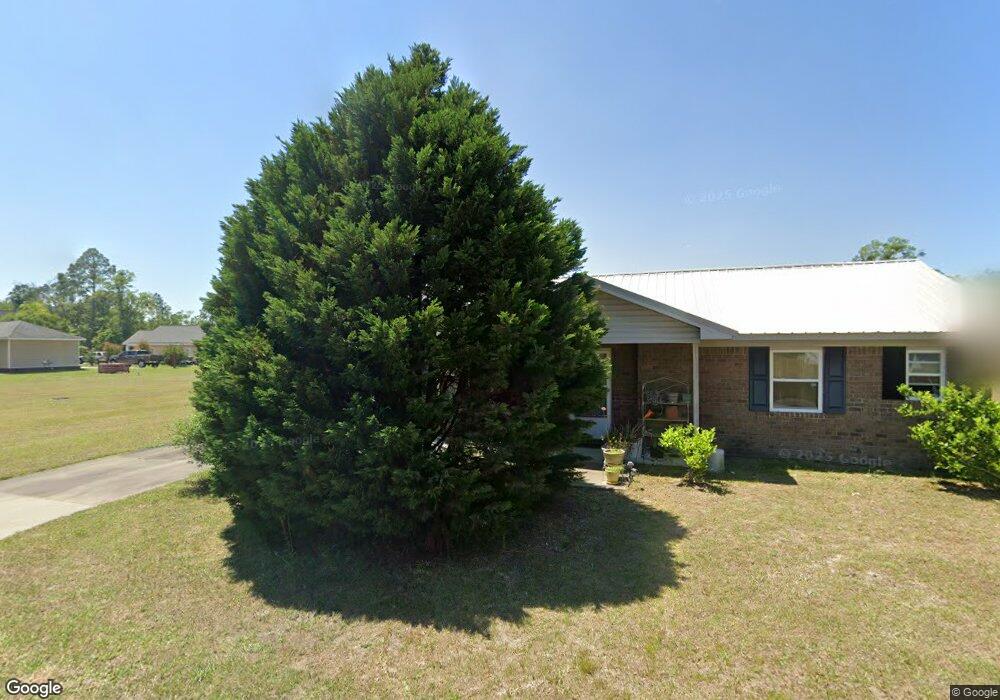
520 Azalea St Hinesville, GA 31313
Estimated Value: $191,000 - $219,000
3
Beds
2
Baths
1,203
Sq Ft
$170/Sq Ft
Est. Value
About This Home
This home is located at 520 Azalea St, Hinesville, GA 31313 and is currently estimated at $204,238, approximately $169 per square foot. 520 Azalea St is a home located in Liberty County with nearby schools including Button Gwinnett Elementary School, Snelson-Golden Middle School, and Bradwell Institute.
Ownership History
Date
Name
Owned For
Owner Type
Purchase Details
Closed on
Aug 22, 2007
Sold by
Roberts Catherine
Bought by
Downtown Dev Authority
Current Estimated Value
Purchase Details
Closed on
Sep 22, 2006
Sold by
Daniels Margaret Keys
Bought by
Downtown Development Authority
Purchase Details
Closed on
Apr 7, 1998
Sold by
Greene Everette
Bought by
Greene Luvenia
Purchase Details
Closed on
Jun 21, 1996
Sold by
Green Luvenia
Bought by
Greene Everette
Purchase Details
Closed on
Aug 2, 1985
Bought by
Green Luvenia
Create a Home Valuation Report for This Property
The Home Valuation Report is an in-depth analysis detailing your home's value as well as a comparison with similar homes in the area
Home Values in the Area
Average Home Value in this Area
Purchase History
| Date | Buyer | Sale Price | Title Company |
|---|---|---|---|
| Downtown Dev Authority | $18,000 | -- | |
| Downtown Development Authority | $11,489 | -- | |
| Greene Luvenia | -- | -- | |
| Greene Everette | -- | -- | |
| Green Luvenia | $2,500 | -- |
Source: Public Records
Tax History Compared to Growth
Tax History
| Year | Tax Paid | Tax Assessment Tax Assessment Total Assessment is a certain percentage of the fair market value that is determined by local assessors to be the total taxable value of land and additions on the property. | Land | Improvement |
|---|---|---|---|---|
| 2024 | $1,492 | $73,970 | $24,000 | $49,970 |
| 2023 | $1,492 | $44,825 | $2,800 | $42,025 |
| 2022 | $961 | $35,274 | $2,800 | $32,474 |
| 2021 | $820 | $31,994 | $2,800 | $29,194 |
| 2020 | $839 | $32,343 | $2,800 | $29,543 |
| 2019 | $849 | $32,692 | $2,800 | $29,892 |
| 2018 | $863 | $33,040 | $2,800 | $30,240 |
| 2017 | $1,099 | $33,388 | $2,800 | $30,588 |
| 2016 | $865 | $33,740 | $2,800 | $30,940 |
| 2015 | $1,082 | $33,740 | $2,800 | $30,940 |
| 2014 | $1,082 | $35,328 | $2,800 | $32,528 |
| 2013 | -- | $32,192 | $1,400 | $30,792 |
Source: Public Records
Map
Nearby Homes