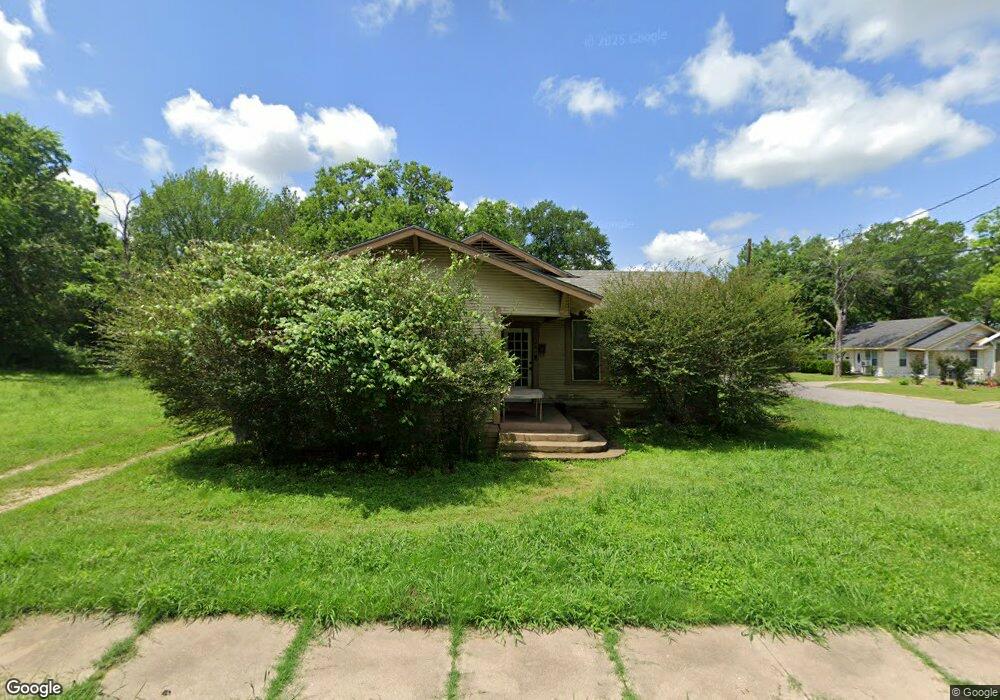
520 N 16th St Corsicana, TX 75110
Estimated Value: $152,527 - $212,000
--
Bed
--
Bath
1,612
Sq Ft
$119/Sq Ft
Est. Value
About This Home
This home is located at 520 N 16th St, Corsicana, TX 75110 and is currently estimated at $191,882, approximately $119 per square foot. 520 N 16th St is a home located in Navarro County with nearby schools including Corsicana High School.
Ownership History
Date
Name
Owned For
Owner Type
Purchase Details
Closed on
Nov 13, 2015
Sold by
Green Michael G and Smith Lona J
Bought by
Castillo Mora Obilon Bolanos and Castillo Mora Tina
Current Estimated Value
Home Financials for this Owner
Home Financials are based on the most recent Mortgage that was taken out on this home.
Original Mortgage
$55,900
Outstanding Balance
$44,011
Interest Rate
3.9%
Mortgage Type
Purchase Money Mortgage
Estimated Equity
$147,871
Create a Home Valuation Report for This Property
The Home Valuation Report is an in-depth analysis detailing your home's value as well as a comparison with similar homes in the area
Home Values in the Area
Average Home Value in this Area
Purchase History
| Date | Buyer | Sale Price | Title Company |
|---|---|---|---|
| Castillo Mora Obilon Bolanos | -- | None Available |
Source: Public Records
Mortgage History
| Date | Status | Borrower | Loan Amount |
|---|---|---|---|
| Open | Castillo Mora Obilon Bolanos | $55,900 |
Source: Public Records
Tax History Compared to Growth
Tax History
| Year | Tax Paid | Tax Assessment Tax Assessment Total Assessment is a certain percentage of the fair market value that is determined by local assessors to be the total taxable value of land and additions on the property. | Land | Improvement |
|---|---|---|---|---|
| 2025 | $2,267 | $119,700 | $30,840 | $88,860 |
| 2024 | $2,361 | $124,690 | $28,460 | $96,230 |
| 2023 | $2,305 | $124,870 | $28,460 | $96,410 |
| 2022 | $1,871 | $80,800 | $11,860 | $68,940 |
| 2021 | $1,693 | $65,140 | $11,860 | $53,280 |
| 2020 | $1,729 | $65,140 | $11,860 | $53,280 |
| 2019 | $1,789 | $65,140 | $11,860 | $53,280 |
| 2018 | $1,724 | $62,770 | $9,490 | $53,280 |
| 2017 | $1,831 | $66,750 | $9,490 | $57,260 |
| 2016 | $1,464 | $53,370 | $9,490 | $43,880 |
| 2015 | -- | $53,370 | $9,490 | $43,880 |
| 2014 | -- | $53,370 | $9,490 | $43,880 |
Source: Public Records
Map
Nearby Homes