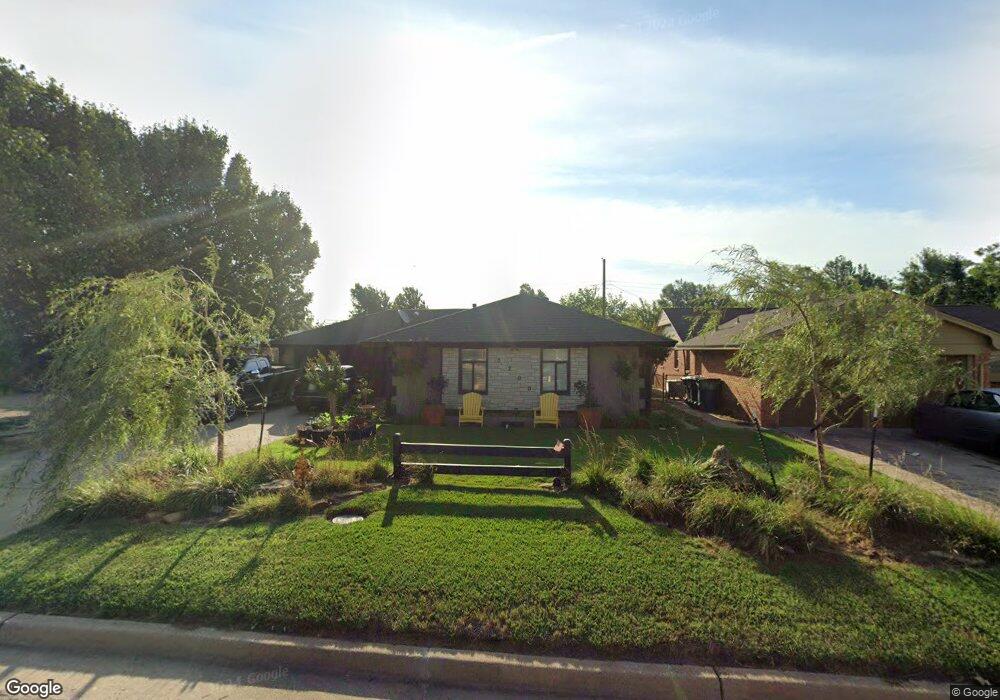
5200 Colfax Place Oklahoma City, OK 73112
Springdale NeighborhoodEstimated Value: $182,000 - $212,000
3
Beds
2
Baths
1,338
Sq Ft
$151/Sq Ft
Est. Value
About This Home
This home is located at 5200 Colfax Place, Oklahoma City, OK 73112 and is currently estimated at $201,958, approximately $150 per square foot. 5200 Colfax Place is a home located in Oklahoma County with nearby schools including Coronado Heights Elementary School, James L. Capps Middle School, and Putnam City High School.
Ownership History
Date
Name
Owned For
Owner Type
Purchase Details
Closed on
Jun 23, 2025
Sold by
Hale Sybil Plumbtree and Hale Sybil Lynn
Bought by
Hale Family Revocable Living Trust and Hale
Current Estimated Value
Purchase Details
Closed on
Mar 19, 2010
Sold by
Hale Sybil Plumbtree and Hale Johnny
Bought by
Hale Sybil Plumbtree and Hale Johnny
Home Financials for this Owner
Home Financials are based on the most recent Mortgage that was taken out on this home.
Original Mortgage
$101,750
Interest Rate
4.5%
Mortgage Type
FHA
Purchase Details
Closed on
Feb 29, 2008
Sold by
Straughn Deborah and Estate Of Bernie Tate Witt Jr
Bought by
Plumbtree Sybil
Home Financials for this Owner
Home Financials are based on the most recent Mortgage that was taken out on this home.
Original Mortgage
$96,239
Interest Rate
5.72%
Mortgage Type
FHA
Create a Home Valuation Report for This Property
The Home Valuation Report is an in-depth analysis detailing your home's value as well as a comparison with similar homes in the area
Home Values in the Area
Average Home Value in this Area
Purchase History
| Date | Buyer | Sale Price | Title Company |
|---|---|---|---|
| Hale Family Revocable Living Trust | -- | None Listed On Document | |
| Hale Family Revocable Living Trust | -- | None Listed On Document | |
| Hale Sybil Plumbtree | -- | The Oklahoma City Abstract & | |
| Plumbtree Sybil | $97,000 | None Available |
Source: Public Records
Mortgage History
| Date | Status | Borrower | Loan Amount |
|---|---|---|---|
| Previous Owner | Hale Sybil Plumbtree | $101,750 | |
| Previous Owner | Plumbtree Sybil | $96,239 |
Source: Public Records
Tax History Compared to Growth
Tax History
| Year | Tax Paid | Tax Assessment Tax Assessment Total Assessment is a certain percentage of the fair market value that is determined by local assessors to be the total taxable value of land and additions on the property. | Land | Improvement |
|---|---|---|---|---|
| 2024 | $1,460 | $15,068 | $1,791 | $13,277 |
| 2023 | $1,460 | $12,973 | $1,244 | $11,729 |
| 2022 | $1,431 | $12,595 | $1,369 | $11,226 |
| 2021 | $1,373 | $12,229 | $1,548 | $10,681 |
| 2020 | $1,323 | $11,873 | $1,615 | $10,258 |
| 2019 | $1,262 | $11,527 | $1,355 | $10,172 |
| 2018 | $1,223 | $11,192 | $0 | $0 |
| 2017 | $1,186 | $10,865 | $1,374 | $9,491 |
| 2016 | $1,146 | $10,548 | $1,389 | $9,159 |
| 2015 | $1,122 | $10,242 | $2,013 | $8,229 |
| 2014 | $1,184 | $10,130 | $2,013 | $8,117 |
Source: Public Records
Map
Nearby Homes
- 4105 NW 50th St
- 4129 NW 51st St
- 5521 N Shawnee Ave
- 5209 N Roff Ave
- 3820 NW 51st Place
- 3917 NW 55th St
- 4124 NW 56th St
- 4117 NW 56th Place
- 3901 NW 44th St
- 4212 NW 45th St
- 4129 NW 57th St
- 5906 N Shawnee Ave
- 4406 NW 54th St
- 4312 NW 56th Terrace
- 4324 NW 47th St
- 4333 NW 55th St
- 4208 NW 43rd St
- 4009 NW 59th St
- 4219 NW 58th St
- 4317 NW 45th St
- 5204 Colfax Place
- 5112 Colfax Place
- 5201 Lombardy Ln
- 5108 Colfax Place
- 5208 Colfax Place
- 5113 Lombardy Ln
- 5205 Lombardy Ln
- 5201 Colfax Place
- 5109 Lombardy Ln
- 5209 Lombardy Ln
- 5104 Colfax Place
- 5212 Colfax Place
- 5205 Colfax Place
- 5111 Colfax Place
- 5105 Lombardy Ln
- 5213 Lombardy Ln
- 5207 Colfax Place
- 5105 Colfax Place
- 5100 Colfax Place
- 5300 Colfax Place