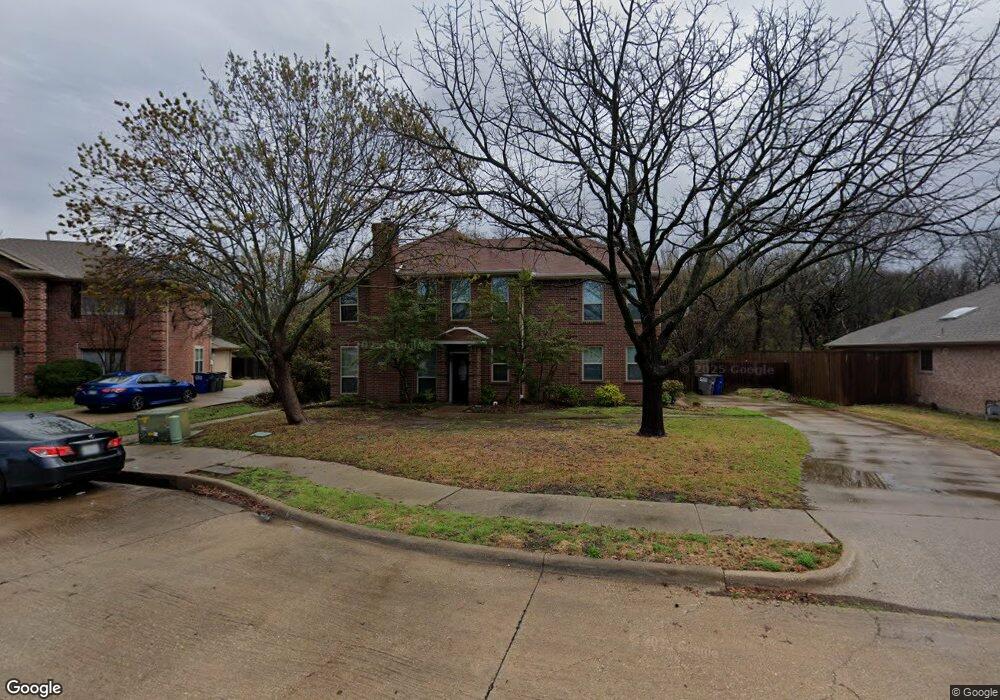
5202 Lee Hutson Ln Sachse, TX 75048
Estimated Value: $367,000 - $387,000
4
Beds
3
Baths
1,812
Sq Ft
$207/Sq Ft
Est. Value
About This Home
This home is located at 5202 Lee Hutson Ln, Sachse, TX 75048 and is currently estimated at $374,340, approximately $206 per square foot. 5202 Lee Hutson Ln is a home located in Dallas County with nearby schools including Firewheel Christian Academy, Pinnacle Montessori of Sachse, and Oakhill Day School.
Ownership History
Date
Name
Owned For
Owner Type
Purchase Details
Closed on
Jun 23, 1998
Sold by
Hud
Bought by
Vance Ivan and Vance Karen
Current Estimated Value
Home Financials for this Owner
Home Financials are based on the most recent Mortgage that was taken out on this home.
Original Mortgage
$113,139
Outstanding Balance
$22,792
Interest Rate
7.13%
Estimated Equity
$351,548
Purchase Details
Closed on
Dec 19, 1997
Sold by
Principal Residential Mtg Inc
Bought by
Hud
Purchase Details
Closed on
Dec 2, 1997
Sold by
English David H and English Djuana V
Bought by
Principal Residential Mtg Inc
Purchase Details
Closed on
Aug 24, 1994
Sold by
Holigan Family Investments Inc
Bought by
English David H and English Djuana
Home Financials for this Owner
Home Financials are based on the most recent Mortgage that was taken out on this home.
Original Mortgage
$96,115
Interest Rate
8.46%
Mortgage Type
FHA
Create a Home Valuation Report for This Property
The Home Valuation Report is an in-depth analysis detailing your home's value as well as a comparison with similar homes in the area
Home Values in the Area
Average Home Value in this Area
Purchase History
| Date | Buyer | Sale Price | Title Company |
|---|---|---|---|
| Vance Ivan | $114,130 | -- | |
| Hud | -- | -- | |
| Principal Residential Mtg Inc | $101,240 | -- | |
| English David H | -- | -- |
Source: Public Records
Mortgage History
| Date | Status | Borrower | Loan Amount |
|---|---|---|---|
| Open | Vance Ivan | $113,139 | |
| Previous Owner | English David H | $96,115 |
Source: Public Records
Tax History Compared to Growth
Tax History
| Year | Tax Paid | Tax Assessment Tax Assessment Total Assessment is a certain percentage of the fair market value that is determined by local assessors to be the total taxable value of land and additions on the property. | Land | Improvement |
|---|---|---|---|---|
| 2025 | $1,148 | $351,880 | $64,000 | $287,880 |
| 2024 | $1,148 | $351,880 | $64,000 | $287,880 |
| 2023 | $1,148 | $305,960 | $64,000 | $241,960 |
| 2022 | $7,320 | $305,960 | $64,000 | $241,960 |
| 2021 | $6,569 | $255,250 | $50,000 | $205,250 |
| 2020 | $6,678 | $255,250 | $50,000 | $205,250 |
| 2019 | $6,631 | $233,770 | $50,000 | $183,770 |
| 2018 | $6,121 | $213,710 | $45,000 | $168,710 |
| 2017 | $6,138 | $213,710 | $45,000 | $168,710 |
| 2016 | $5,303 | $184,660 | $28,000 | $156,660 |
| 2015 | $1,760 | $160,550 | $28,000 | $132,550 |
| 2014 | $1,760 | $142,870 | $28,000 | $114,870 |
Source: Public Records
Map
Nearby Homes
- 5014 Brookhollow Dr
- 4818 Westcreek Ln
- 4924 Westcreek Ln
- 4406 Westcreek Ln
- 5824 Boone St
- 2422 Ash Ln
- 2418 Ash Ln
- 2414 Ash Ln
- 2402 Ash Ln
- 2402 Bent Oak Trail
- 2406 Bent Oak Trail
- 3408 Lillie St
- 5937 Boone St
- 2209 Vicksburg Dr
- 3711 7th St
- 2006 Cornwall Ln
- 3476 Rosewood Ln
- 3324 Salmon St
- 3320 Salmon St
- 6218 Dewitt St
- 5200 Lee Hutson Ln
- 5204 Lee Hutson Ln
- 5206 Lee Hutson Ln
- 5108 Lee Hutson Ln
- 5205 Lee Hutson Ln
- 5111 Lee Hutson Ln
- 5208 Lee Hutson Ln
- 4904 Brookhollow Dr
- 5301 Lee Hutson Ln
- 5109 Lee Hutson Ln
- 5106 Lee Hutson Ln
- 3206 Willow Creek Ct
- 5303 Lee Hutson Ln
- 4908 Brookhollow Dr
- 5104 Lee Hutson Ln
- 2504 Barger Ct
- 5105 Lee Hutson Ln
- 2506 Barger Ct
- 5305 Lee Hutson Ln
- 3208 Willow Creek Ct