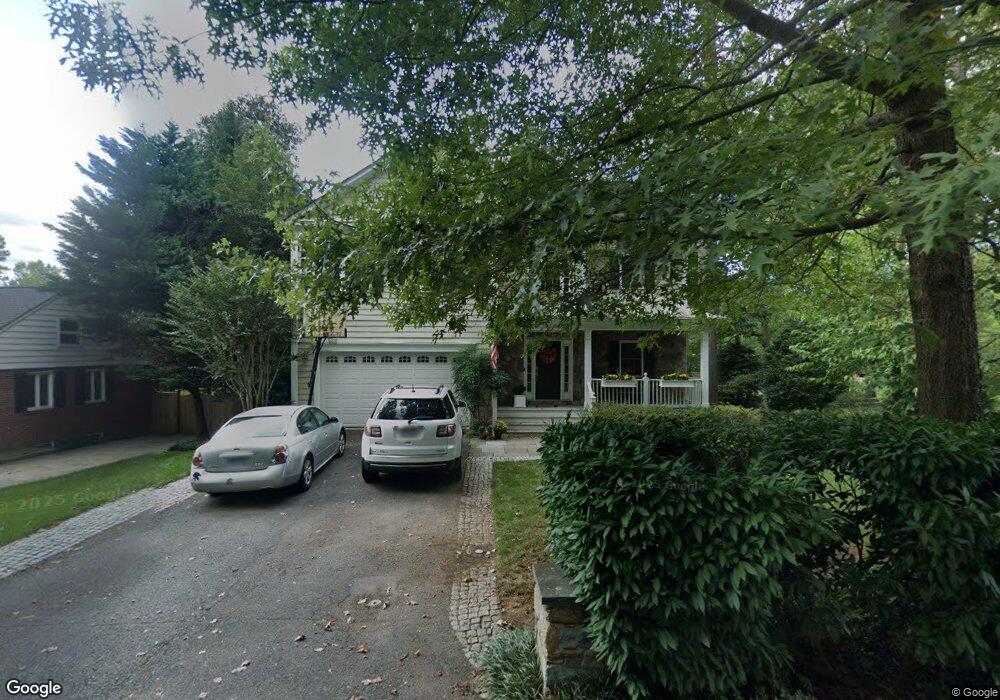
521 Meridian St Falls Church, VA 22046
Estimated Value: $1,897,384 - $1,976,000
4
Beds
5
Baths
4,072
Sq Ft
$477/Sq Ft
Est. Value
About This Home
This home is located at 521 Meridian St, Falls Church, VA 22046 and is currently estimated at $1,942,346, approximately $477 per square foot. 521 Meridian St is a home located in Falls Church City with nearby schools including Mt. Daniel Elementary School, Mary Ellen Henderson Middle School, and Meridian High School.
Ownership History
Date
Name
Owned For
Owner Type
Purchase Details
Closed on
Nov 25, 2008
Sold by
Mars Susan S De
Bought by
Miller Christopher J
Current Estimated Value
Home Financials for this Owner
Home Financials are based on the most recent Mortgage that was taken out on this home.
Original Mortgage
$729,750
Outstanding Balance
$490,121
Interest Rate
6.47%
Mortgage Type
New Conventional
Estimated Equity
$1,452,225
Purchase Details
Closed on
Oct 8, 2002
Sold by
Celebrity Homes L C
Bought by
Demars Susan
Home Financials for this Owner
Home Financials are based on the most recent Mortgage that was taken out on this home.
Original Mortgage
$695,300
Interest Rate
6.24%
Purchase Details
Closed on
Mar 31, 2002
Sold by
Cerio Daniel
Bought by
Celebrity Homes L C
Create a Home Valuation Report for This Property
The Home Valuation Report is an in-depth analysis detailing your home's value as well as a comparison with similar homes in the area
Home Values in the Area
Average Home Value in this Area
Purchase History
| Date | Buyer | Sale Price | Title Company |
|---|---|---|---|
| Miller Christopher J | $1,175,000 | -- | |
| Demars Susan | $869,130 | -- | |
| Celebrity Homes L C | $300,000 | -- |
Source: Public Records
Mortgage History
| Date | Status | Borrower | Loan Amount |
|---|---|---|---|
| Open | Miller Christopher J | $729,750 | |
| Previous Owner | Demars Susan | $695,300 |
Source: Public Records
Tax History Compared to Growth
Tax History
| Year | Tax Paid | Tax Assessment Tax Assessment Total Assessment is a certain percentage of the fair market value that is determined by local assessors to be the total taxable value of land and additions on the property. | Land | Improvement |
|---|---|---|---|---|
| 2025 | $17,504 | $1,609,100 | $646,100 | $963,000 |
| 2024 | $17,504 | $1,423,100 | $603,800 | $819,300 |
| 2023 | $17,396 | $1,414,300 | $525,100 | $889,200 |
| 2022 | $16,604 | $1,340,400 | $525,100 | $815,300 |
| 2021 | $16,885 | $1,257,900 | $480,800 | $777,100 |
| 2020 | $16,743 | $1,215,300 | $464,500 | $750,800 |
| 2019 | $16,458 | $1,194,300 | $443,500 | $750,800 |
| 2018 | $15,662 | $1,184,100 | $433,300 | $750,800 |
| 2017 | $7,643 | $1,154,400 | $433,300 | $721,100 |
| 2016 | $7,502 | $1,120,500 | $433,300 | $687,200 |
| 2015 | $15,005 | $1,120,500 | $433,300 | $687,200 |
| 2014 | $14,866 | $1,120,500 | $433,300 | $687,200 |
Source: Public Records
Map
Nearby Homes
- 6703 Hallwood Ave
- 2300 Meridian St
- 6707 Hallwood Ave
- 2302 Westmoreland St
- 812 Fulton Ave
- 2828 N Van Buren St
- 6601 Gordon Ave
- 6613 Fisher Ave
- 677 Park Ave
- 156 N Lee St
- 154 N Lee St
- 150 N Lee St
- 721 Park Ave
- 140 N Oak St
- 727 Park Ave
- 6616 Fisher Ave
- 502 W Broad St Unit 501
- 502 W Broad St Unit 215
- 2221 Orchid Dr
- 444 W Broad St Unit 617
- 519 Meridian St
- 7979 Meridian St
- 608 Langston Ln
- 517 Meridian St
- 606 Langston Ln
- 814 North West St
- 610 Langston Ln
- 812 North West St
- 408N Dorchester Rd
- 2825 N Arizona St
- 604 Langston Ln
- 515 Meridian St
- 810 North West St
- 7048 Williamsburg Blvd
- 814 N West St
- 613 Langston Ln
- 2801 N Arizona St
- 810 N West St
- 806 North West St
- 812 N West St