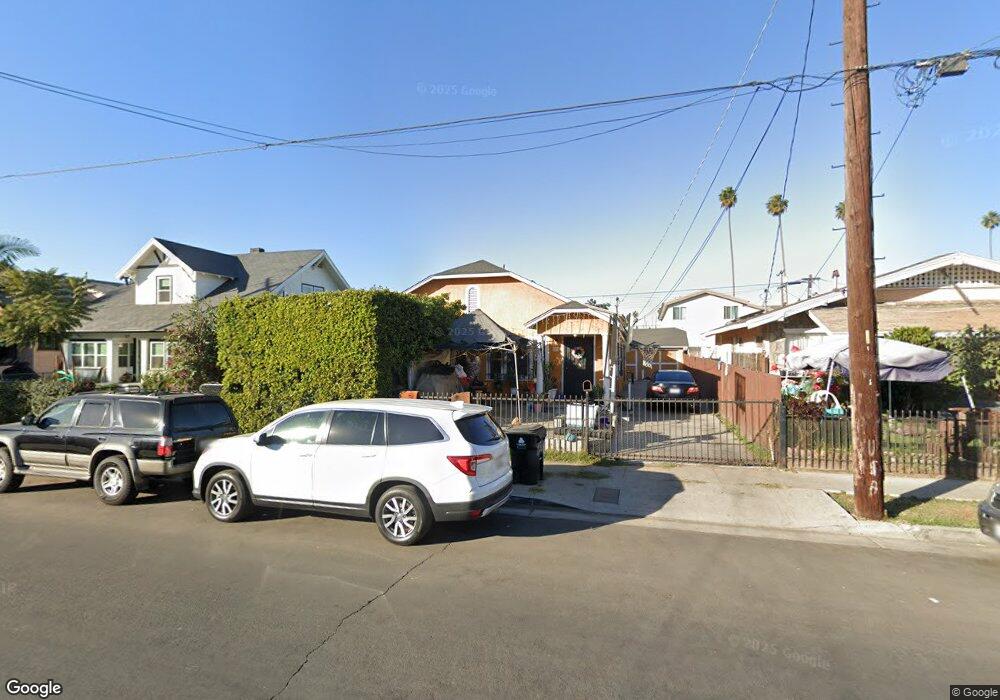
521 W 52nd St Los Angeles, CA 90037
Vermont Square NeighborhoodEstimated Value: $695,000 - $881,000
2
Beds
2
Baths
2,009
Sq Ft
$381/Sq Ft
Est. Value
About This Home
This home is located at 521 W 52nd St, Los Angeles, CA 90037 and is currently estimated at $765,409, approximately $380 per square foot. 521 W 52nd St is a home located in Los Angeles County with nearby schools including Fifty-Second Street Elementary School, John Muir Middle School, and Augustus F. Hawkins High A Critical Design And Gaming.
Ownership History
Date
Name
Owned For
Owner Type
Purchase Details
Closed on
Mar 14, 2003
Sold by
Anaya Denis
Bought by
Anaya Denis and Anaya Ana M
Current Estimated Value
Home Financials for this Owner
Home Financials are based on the most recent Mortgage that was taken out on this home.
Original Mortgage
$129,700
Interest Rate
5.82%
Purchase Details
Closed on
May 10, 2000
Sold by
Montano Jozafat
Bought by
Anaya Denis and Anaya Ana M
Create a Home Valuation Report for This Property
The Home Valuation Report is an in-depth analysis detailing your home's value as well as a comparison with similar homes in the area
Home Values in the Area
Average Home Value in this Area
Purchase History
| Date | Buyer | Sale Price | Title Company |
|---|---|---|---|
| Anaya Denis | -- | Fidelity | |
| Anaya Denis | -- | -- | |
| Anaya Ana M | -- | -- |
Source: Public Records
Mortgage History
| Date | Status | Borrower | Loan Amount |
|---|---|---|---|
| Closed | Anaya Denis | $129,700 |
Source: Public Records
Tax History Compared to Growth
Tax History
| Year | Tax Paid | Tax Assessment Tax Assessment Total Assessment is a certain percentage of the fair market value that is determined by local assessors to be the total taxable value of land and additions on the property. | Land | Improvement |
|---|---|---|---|---|
| 2025 | $3,536 | $271,208 | $180,809 | $90,399 |
| 2024 | $3,536 | $265,891 | $177,264 | $88,627 |
| 2023 | $3,477 | $260,679 | $173,789 | $86,890 |
| 2022 | $3,327 | $255,569 | $170,382 | $85,187 |
| 2021 | $3,275 | $250,559 | $167,042 | $83,517 |
| 2019 | $3,183 | $243,130 | $162,089 | $81,041 |
| 2018 | $3,102 | $238,363 | $158,911 | $79,452 |
| 2016 | $2,951 | $229,110 | $152,742 | $76,368 |
| 2015 | $2,911 | $225,669 | $150,448 | $75,221 |
| 2014 | $2,935 | $221,249 | $147,501 | $73,748 |
Source: Public Records
Map
Nearby Homes