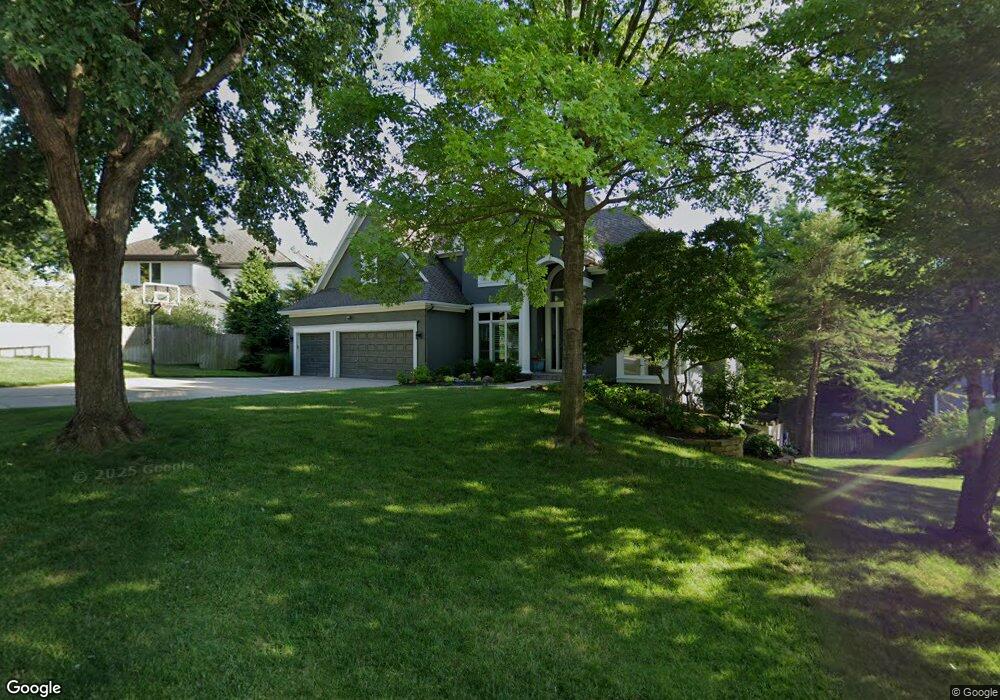
5210 Rene St Shawnee, KS 66216
Estimated Value: $555,064 - $585,000
5
Beds
5
Baths
3,216
Sq Ft
$177/Sq Ft
Est. Value
About This Home
This home is located at 5210 Rene St, Shawnee, KS 66216 and is currently estimated at $569,016, approximately $176 per square foot. 5210 Rene St is a home located in Johnson County with nearby schools including Ray Marsh Elementary School, Trailridge Middle School, and Shawnee Mission Northwest High School.
Ownership History
Date
Name
Owned For
Owner Type
Purchase Details
Closed on
Sep 12, 2024
Sold by
Oberbroeckling Thomas J and Oberbroeckling Kathryn L
Bought by
Thomas J Oberbroeckling And Kathryn L Oberbro
Current Estimated Value
Purchase Details
Closed on
Apr 27, 2009
Sold by
Federal National Mortgage Association
Bought by
Oberbroeckling Thomas J and Oberbroeckling Kathryn L
Home Financials for this Owner
Home Financials are based on the most recent Mortgage that was taken out on this home.
Original Mortgage
$285,000
Interest Rate
5.03%
Mortgage Type
Purchase Money Mortgage
Purchase Details
Closed on
Nov 15, 2007
Sold by
Graver Matthew and Graver Mary E
Bought by
Federal National Mortgage Association
Purchase Details
Closed on
Dec 7, 2000
Sold by
Dobson James S and Dobson Liane H
Bought by
Graver Mary E
Home Financials for this Owner
Home Financials are based on the most recent Mortgage that was taken out on this home.
Original Mortgage
$241,500
Interest Rate
7.55%
Create a Home Valuation Report for This Property
The Home Valuation Report is an in-depth analysis detailing your home's value as well as a comparison with similar homes in the area
Home Values in the Area
Average Home Value in this Area
Purchase History
| Date | Buyer | Sale Price | Title Company |
|---|---|---|---|
| Thomas J Oberbroeckling And Kathryn L Oberbro | -- | None Listed On Document | |
| Oberbroeckling Thomas J | -- | Stewart Title | |
| Federal National Mortgage Association | $374,483 | None Available | |
| Graver Mary E | -- | Security Land Title Company |
Source: Public Records
Mortgage History
| Date | Status | Borrower | Loan Amount |
|---|---|---|---|
| Previous Owner | Oberbroeckling Thomas J | $285,000 | |
| Previous Owner | Graver Mary E | $241,500 |
Source: Public Records
Tax History Compared to Growth
Tax History
| Year | Tax Paid | Tax Assessment Tax Assessment Total Assessment is a certain percentage of the fair market value that is determined by local assessors to be the total taxable value of land and additions on the property. | Land | Improvement |
|---|---|---|---|---|
| 2024 | $5,806 | $54,521 | $13,372 | $41,149 |
| 2023 | $5,715 | $53,211 | $12,732 | $40,479 |
| 2022 | $5,576 | $51,739 | $12,732 | $39,007 |
| 2021 | $5,394 | $47,150 | $11,564 | $35,586 |
| 2020 | $5,065 | $43,689 | $10,119 | $33,570 |
| 2019 | $4,933 | $42,527 | $9,197 | $33,330 |
| 2018 | $4,856 | $41,699 | $9,197 | $32,502 |
| 2017 | $4,724 | $39,940 | $8,361 | $31,579 |
| 2016 | $4,850 | $40,492 | $8,361 | $32,131 |
| 2015 | $4,528 | $39,066 | $8,361 | $30,705 |
| 2013 | -- | $34,466 | $8,361 | $26,105 |
Source: Public Records
Map
Nearby Homes
- 13810 W 53rd St
- 5300 Summit Ct
- 14210 W 50th St
- 5530 Rene St
- 5507 Noland Rd
- 14105 W 48th Terrace
- 5021 Bradshaw St
- 5013 Bradshaw St
- 5502 Mullen Rd
- 13305 W 51st St
- 5703 Cottonwood St
- 4940 Alden St
- 14170 W 49th St
- 5713 Widmer Rd
- 5633 Oakview St
- 5807 Noland Rd
- 12809 W 57th Terrace
- 13130 W 52nd Terrace
- 13126 W 52nd Terrace
- 13134 W 52nd Terrace