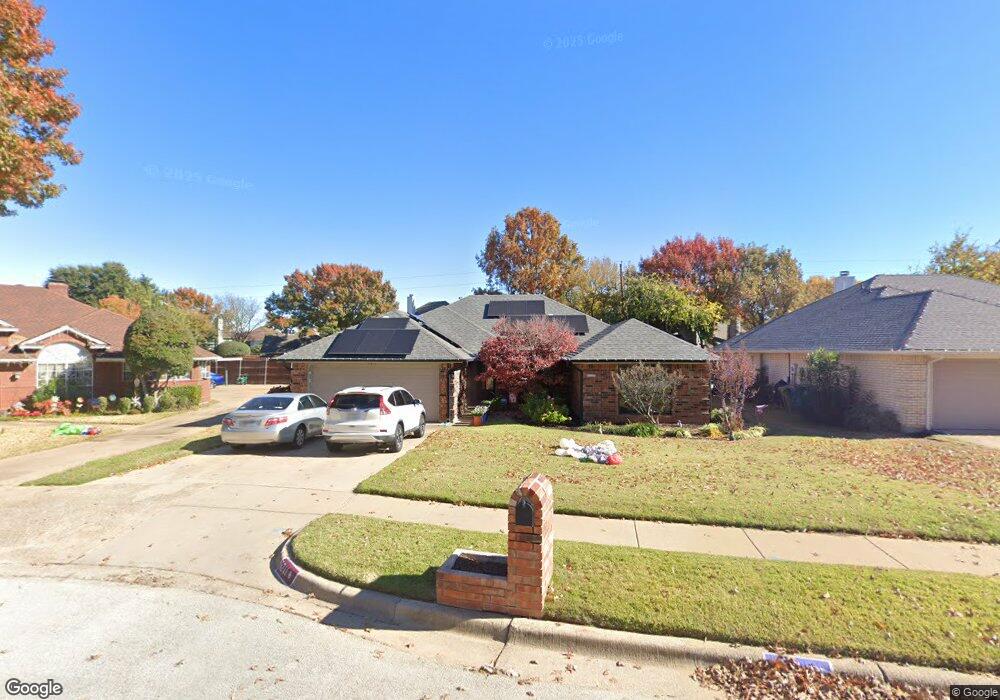
5211 Fairmount Dr Grapevine, TX 76051
Estimated Value: $485,000 - $566,000
4
Beds
2
Baths
1,812
Sq Ft
$282/Sq Ft
Est. Value
About This Home
This home is located at 5211 Fairmount Dr, Grapevine, TX 76051 and is currently estimated at $510,603, approximately $281 per square foot. 5211 Fairmount Dr is a home located in Tarrant County with nearby schools including Grapevine Elementary School, Heritage Middle School, and Holy Trinity Catholic School.
Ownership History
Date
Name
Owned For
Owner Type
Purchase Details
Closed on
Dec 8, 1999
Sold by
Zimney Bobby D and Zimney Nichole M
Bought by
Prudential Residential Svcs Ltd Prtnrshp
Current Estimated Value
Purchase Details
Closed on
Oct 15, 1998
Sold by
Kristek Steven M and Kristek Kathleen
Bought by
Zimney Bobby D and Zimney Nichole M
Home Financials for this Owner
Home Financials are based on the most recent Mortgage that was taken out on this home.
Original Mortgage
$111,900
Interest Rate
6.3%
Purchase Details
Closed on
Jan 10, 1997
Sold by
Young Kirk D and Young Melissa J Collins
Bought by
Kristek Steven M and Kristek Kathleen
Home Financials for this Owner
Home Financials are based on the most recent Mortgage that was taken out on this home.
Original Mortgage
$108,000
Interest Rate
7.43%
Create a Home Valuation Report for This Property
The Home Valuation Report is an in-depth analysis detailing your home's value as well as a comparison with similar homes in the area
Home Values in the Area
Average Home Value in this Area
Purchase History
| Date | Buyer | Sale Price | Title Company |
|---|---|---|---|
| Prudential Residential Svcs Ltd Prtnrshp | -- | Alamo Title Company | |
| Zimney Bobby D | -- | Alamo Title Co | |
| Kristek Steven M | -- | Trinity Western Title Co |
Source: Public Records
Mortgage History
| Date | Status | Borrower | Loan Amount |
|---|---|---|---|
| Previous Owner | Zimney Bobby D | $111,900 | |
| Previous Owner | Kristek Steven M | $108,000 | |
| Closed | Kristek Steven M | $12,000 |
Source: Public Records
Tax History Compared to Growth
Tax History
| Year | Tax Paid | Tax Assessment Tax Assessment Total Assessment is a certain percentage of the fair market value that is determined by local assessors to be the total taxable value of land and additions on the property. | Land | Improvement |
|---|---|---|---|---|
| 2025 | $2,214 | $459,102 | $93,850 | $365,252 |
| 2024 | $2,214 | $459,102 | $93,850 | $365,252 |
| 2023 | $8,327 | $496,711 | $93,850 | $402,861 |
| 2022 | $7,868 | $397,118 | $93,850 | $303,268 |
| 2021 | $7,221 | $332,092 | $75,000 | $257,092 |
| 2020 | $7,756 | $352,603 | $75,000 | $277,603 |
| 2019 | $8,084 | $354,502 | $75,000 | $279,502 |
| 2018 | $2,033 | $341,932 | $75,000 | $266,932 |
| 2017 | $6,918 | $299,126 | $50,000 | $249,126 |
| 2016 | $6,771 | $292,780 | $50,000 | $242,780 |
| 2015 | $4,989 | $217,500 | $28,000 | $189,500 |
| 2014 | $4,989 | $217,500 | $28,000 | $189,500 |
Source: Public Records
Map
Nearby Homes
- 1803 Haydenbend Cir
- 516 Briarcroft Dr
- 4360 Bradford Dr
- 4336 Kenwood Dr
- 2922 Hilltop Dr
- 709 Normandy Dr
- 610 Canterbury St
- 326 Park Hill Ln
- 3010 Honey Locust Dr
- 3013 Peppercorn Dr
- 1917 Waterford Dr
- 211 Nutmeg Ln
- 2611 Jenny Ln
- 609 Knott Ct
- 105 Clove Ln
- 309 Westover Dr
- 2602 Kayli Ln
- 3933 Blackjack Oak Dr
- 3602 Soft Wind Ct
- 3908 Heritage Oaks Dr
- 5213 Fairmount Dr
- 5209 Fairmount Dr
- 612 Ellington Dr
- 613 Ellington Dr
- 5215 Fairmount Dr
- 5207 Fairmount Dr
- 610 Ellington Dr
- 611 Huntington Ct
- 5205 Fairmount Dr
- 5208 Fairmount Dr
- 611 Ellington Dr
- 5210 Fairmount Dr
- 1602 Haydenbend Cir
- 613 Huntington Ct
- 614 Ashcroft Dr
- 5101 Haydenbend Cir
- 612 Ashcroft Dr
- 608 Ellington Dr
- 616 Ashcroft Dr
- 5203 Fairmount Dr