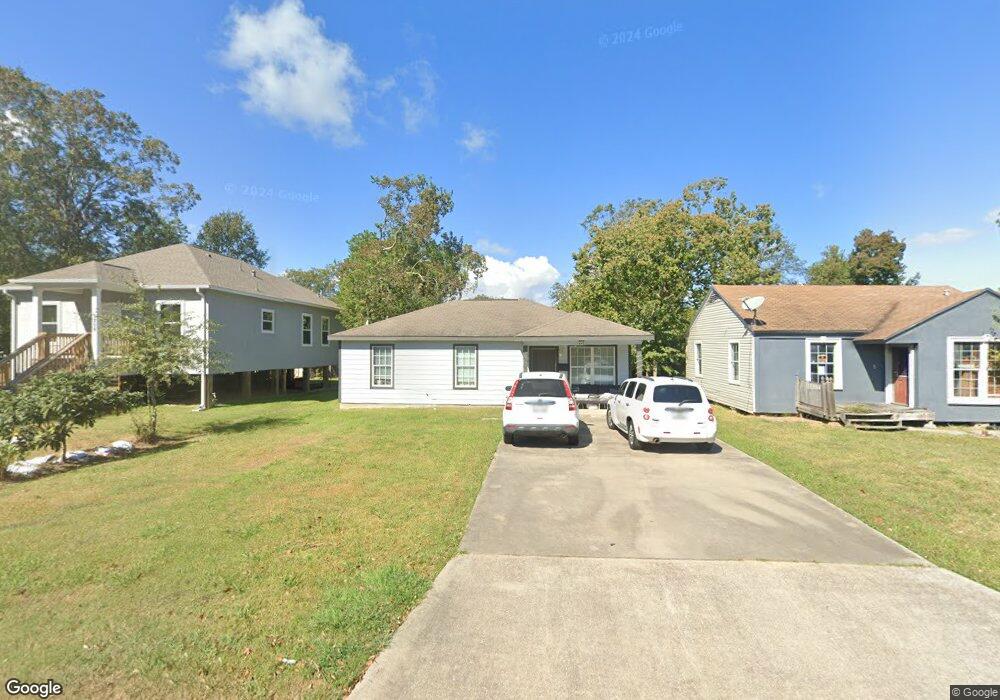
5213 10th St Port Arthur, TX 77642
Estimated Value: $77,000 - $94,422
3
Beds
1
Bath
900
Sq Ft
$94/Sq Ft
Est. Value
About This Home
This home is located at 5213 10th St, Port Arthur, TX 77642 and is currently estimated at $84,856, approximately $94 per square foot. 5213 10th St is a home located in Jefferson County with nearby schools including Travis Elementary School, Jefferson Middle School, and Memorial High School.
Ownership History
Date
Name
Owned For
Owner Type
Purchase Details
Closed on
Sep 19, 2023
Sold by
Cardenas Juan and Cardenas Veronica
Bought by
Garcia Edmond and Villasana Jennifer
Current Estimated Value
Home Financials for this Owner
Home Financials are based on the most recent Mortgage that was taken out on this home.
Original Mortgage
$84,452
Outstanding Balance
$82,661
Interest Rate
6.96%
Mortgage Type
FHA
Estimated Equity
$2,195
Purchase Details
Closed on
Jan 26, 2022
Sold by
Wayne Jones Dwight
Bought by
Cardenas Juan and Cardenas Veronica
Create a Home Valuation Report for This Property
The Home Valuation Report is an in-depth analysis detailing your home's value as well as a comparison with similar homes in the area
Home Values in the Area
Average Home Value in this Area
Purchase History
| Date | Buyer | Sale Price | Title Company |
|---|---|---|---|
| Garcia Edmond | -- | Stewart Title | |
| Cardenas Juan | -- | Stewart Title |
Source: Public Records
Mortgage History
| Date | Status | Borrower | Loan Amount |
|---|---|---|---|
| Open | Garcia Edmond | $84,452 |
Source: Public Records
Tax History Compared to Growth
Tax History
| Year | Tax Paid | Tax Assessment Tax Assessment Total Assessment is a certain percentage of the fair market value that is determined by local assessors to be the total taxable value of land and additions on the property. | Land | Improvement |
|---|---|---|---|---|
| 2025 | $641 | $101,925 | $6,750 | $95,175 |
| 2024 | $641 | $94,201 | $2,425 | $91,776 |
| 2023 | $641 | $74,657 | $2,425 | $72,232 |
| 2022 | $2,506 | $78,905 | $2,425 | $76,480 |
| 2021 | $2,615 | $78,905 | $2,425 | $76,480 |
| 2020 | $1,445 | $43,593 | $2,425 | $41,168 |
| 2019 | $1,413 | $43,600 | $2,430 | $41,170 |
| 2018 | $1,390 | $43,600 | $2,430 | $41,170 |
| 2017 | $1,426 | $46,020 | $2,430 | $43,590 |
| 2016 | $1,348 | $46,020 | $2,430 | $43,590 |
| 2015 | $1,446 | $48,440 | $2,430 | $46,010 |
| 2014 | $1,446 | $48,440 | $2,430 | $46,010 |
Source: Public Records
Map
Nearby Homes