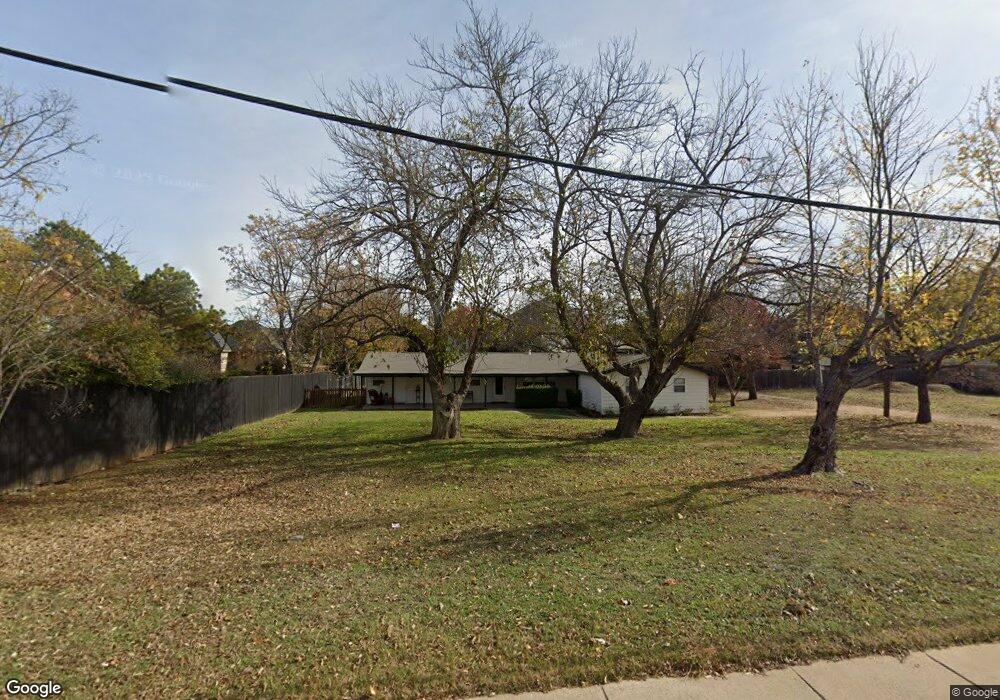
5213 Pool Rd Colleyville, TX 76034
Estimated Value: $465,000 - $575,873
3
Beds
3
Baths
2,363
Sq Ft
$220/Sq Ft
Est. Value
About This Home
This home is located at 5213 Pool Rd, Colleyville, TX 76034 and is currently estimated at $520,437, approximately $220 per square foot. 5213 Pool Rd is a home located in Tarrant County with nearby schools including O.C. Taylor Elementary School, Colleyville Middle School, and Waypoint Montessori.
Ownership History
Date
Name
Owned For
Owner Type
Purchase Details
Closed on
Nov 22, 2019
Sold by
Madewell Brent A and Madewell Kimberly K
Bought by
Mikulik Walter K
Current Estimated Value
Home Financials for this Owner
Home Financials are based on the most recent Mortgage that was taken out on this home.
Original Mortgage
$222,000
Outstanding Balance
$149,155
Interest Rate
3.5%
Mortgage Type
New Conventional
Estimated Equity
$371,282
Purchase Details
Closed on
Jun 28, 2017
Sold by
Ulysses Diaz De Leon
Bought by
Madewell Kim and Madewell Kimberly
Home Financials for this Owner
Home Financials are based on the most recent Mortgage that was taken out on this home.
Original Mortgage
$219,000
Interest Rate
3.9%
Purchase Details
Closed on
Aug 17, 1995
Sold by
Chappell Fred E and Chappell Pauline
Bought by
Madewell Brent A and Madewell Brent
Home Financials for this Owner
Home Financials are based on the most recent Mortgage that was taken out on this home.
Original Mortgage
$71,200
Interest Rate
7.39%
Create a Home Valuation Report for This Property
The Home Valuation Report is an in-depth analysis detailing your home's value as well as a comparison with similar homes in the area
Home Values in the Area
Average Home Value in this Area
Purchase History
| Date | Buyer | Sale Price | Title Company |
|---|---|---|---|
| Mikulik Walter K | -- | Capital Title | |
| Madewell Kim | -- | -- | |
| Madewell Brent A | -- | Rattikin Title Co |
Source: Public Records
Mortgage History
| Date | Status | Borrower | Loan Amount |
|---|---|---|---|
| Open | Mikulik Walter K | $222,000 | |
| Previous Owner | Madewell Kim | $219,000 | |
| Previous Owner | Madewell Kim | -- | |
| Previous Owner | Madewell Brent A | $71,200 |
Source: Public Records
Tax History Compared to Growth
Tax History
| Year | Tax Paid | Tax Assessment Tax Assessment Total Assessment is a certain percentage of the fair market value that is determined by local assessors to be the total taxable value of land and additions on the property. | Land | Improvement |
|---|---|---|---|---|
| 2025 | $1,833 | $367,000 | $254,035 | $112,965 |
| 2024 | $1,833 | $380,000 | $254,035 | $125,965 |
| 2023 | $6,815 | $404,000 | $254,035 | $149,965 |
| 2022 | $6,913 | $350,000 | $254,035 | $95,965 |
| 2021 | $5,991 | $272,824 | $158,070 | $114,754 |
| 2020 | $5,411 | $243,503 | $158,070 | $85,433 |
| 2019 | $3,470 | $245,329 | $158,070 | $87,259 |
| 2018 | $811 | $136,428 | $66,550 | $69,878 |
| 2017 | $2,930 | $243,272 | $158,070 | $85,202 |
| 2016 | $2,664 | $220,192 | $155,070 | $65,122 |
| 2015 | $2,177 | $102,500 | $50,000 | $52,500 |
| 2014 | $2,177 | $102,500 | $50,000 | $52,500 |
Source: Public Records
Map
Nearby Homes
- 2906 Edgewood Ln
- 2906 Cottonwood Ln
- 4282 Hearthside Dr
- 4214 Hearthside Dr
- 4213 Hearthside Dr
- 3321 Circlewood Ct
- 3329 Moss Creek Dr
- 5504 Sycamore Dr
- 3278 Birch Ave
- 3216 Glade Rd
- 4723 Bill Simmons Rd
- 5404 Miramar Ln
- 4816 Bill Simmons Rd
- 3301 Queensbury Way W
- 4612 Bill Simmons Rd
- 4309 Meandering Way
- 1808 Arthur Dr
- 3409 Crossgate Cir N
- 5613 Versailles Ct
- 1916 Renfro Rd
- 5209 Pool Rd
- 2701 Red Oak Ct W
- 2800 Edgewood Ln
- 2703 Red Oak Ct W
- 2801 Edgewood Ln
- 2705 Red Oak Ct W
- 2700 Red Oak Ct W
- 2700 Highgrove Ct
- 2802 Edgewood Ln
- 2702 Red Oak Ct W
- 2704 Highgrove Ct
- 5208 Pool Rd
- 2803 Edgewood Ln
- 2704 Red Oak Ct W
- 5300 Maple Ln
- 5204 Pool Rd
- 2708 Highgrove Ct
- 2804 Edgewood Ln
- 5301 Maple Ln
- 2805 Edgewood Ln