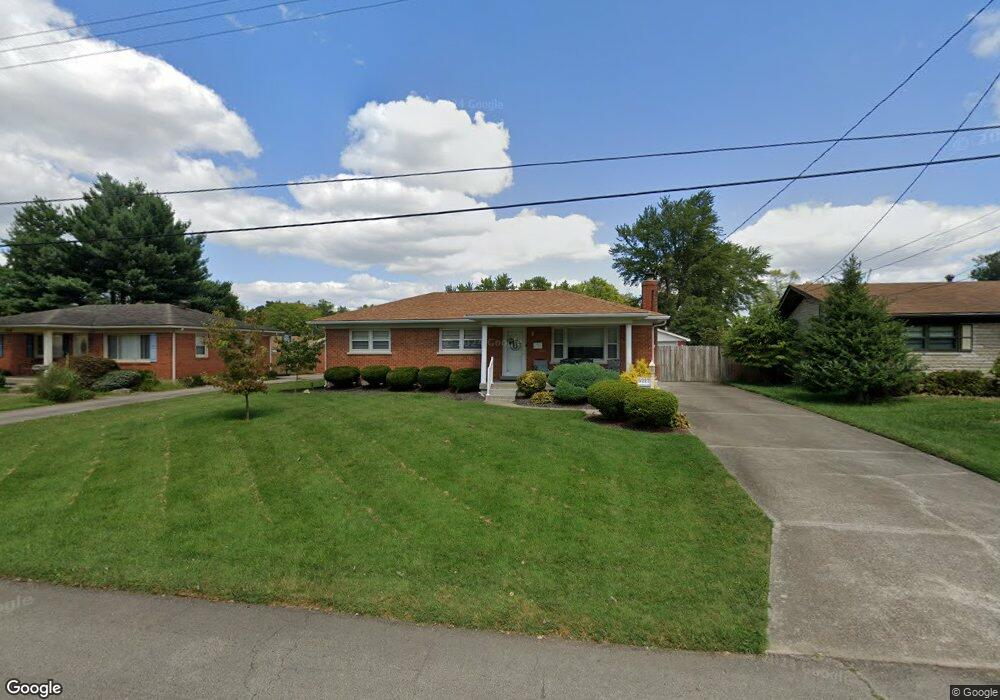
5217 Planet Dr Louisville, KY 40258
Pleasure Ridge Park NeighborhoodEstimated Value: $216,056 - $261,000
--
Bed
1
Bath
1,125
Sq Ft
$217/Sq Ft
Est. Value
About This Home
This home is located at 5217 Planet Dr, Louisville, KY 40258 and is currently estimated at $244,514, approximately $217 per square foot. 5217 Planet Dr is a home located in Jefferson County with nearby schools including Shacklette Elementary School, Wilkerson Elementary School, and Kerrick Elementary School.
Ownership History
Date
Name
Owned For
Owner Type
Purchase Details
Closed on
Aug 23, 2017
Sold by
Borders Heather Nicole
Bought by
Borders Charles R
Current Estimated Value
Purchase Details
Closed on
Jul 18, 2017
Sold by
Borders Heather Nicole
Bought by
Borders Charles R
Purchase Details
Closed on
Sep 28, 2016
Sold by
Triplett Karen
Bought by
Borders Charles R and Borders Heather N
Home Financials for this Owner
Home Financials are based on the most recent Mortgage that was taken out on this home.
Original Mortgage
$129,117
Outstanding Balance
$103,413
Interest Rate
3.43%
Mortgage Type
FHA
Estimated Equity
$141,101
Purchase Details
Closed on
Jul 24, 2013
Sold by
Mahoney Christy Dawn and Mahoney Michael Jason
Bought by
Triplett Karen
Purchase Details
Closed on
Jul 26, 2002
Sold by
Cook James Howard and Cook Sharon Marie
Bought by
Mahoney Christy
Create a Home Valuation Report for This Property
The Home Valuation Report is an in-depth analysis detailing your home's value as well as a comparison with similar homes in the area
Home Values in the Area
Average Home Value in this Area
Purchase History
| Date | Buyer | Sale Price | Title Company |
|---|---|---|---|
| Borders Charles R | -- | None Available | |
| Borders Charles R | -- | None Available | |
| Borders Charles R | $131,500 | Executive Title Co | |
| Triplett Karen | $97,570 | None Available | |
| Mahoney Christy | $137,950 | -- |
Source: Public Records
Mortgage History
| Date | Status | Borrower | Loan Amount |
|---|---|---|---|
| Open | Borders Charles R | $129,117 |
Source: Public Records
Tax History Compared to Growth
Tax History
| Year | Tax Paid | Tax Assessment Tax Assessment Total Assessment is a certain percentage of the fair market value that is determined by local assessors to be the total taxable value of land and additions on the property. | Land | Improvement |
|---|---|---|---|---|
| 2024 | $2,027 | $173,950 | $24,000 | $149,950 |
| 2023 | $2,084 | $173,950 | $24,000 | $149,950 |
| 2022 | $1,552 | $129,090 | $25,000 | $104,090 |
| 2021 | $1,672 | $129,090 | $25,000 | $104,090 |
| 2020 | $1,494 | $129,090 | $25,000 | $104,090 |
| 2019 | $1,464 | $129,090 | $25,000 | $104,090 |
| 2018 | $1,473 | $131,500 | $24,000 | $107,500 |
| 2017 | $1,380 | $131,500 | $24,000 | $107,500 |
| 2013 | $1,431 | $143,080 | $24,000 | $119,080 |
Source: Public Records
Map
Nearby Homes
- 5225 Venus Dr
- 6504 Gabriel Dr
- 5217 Galaxie Dr
- 6506 Gabriel Dr
- 5310 Galaxie Dr
- 6607 Sky Blue Ave
- 2333 Lower Hunters Trace
- 5400 Galaxie Dr
- 6300 Derrick Dr
- 6606 Lunar Dr
- 6115 Greenview Dr
- 5220 Skylight Dr
- 6711 Astral Dr
- 4912 Hunters Point Cir
- 7109 Uranus Dr
- 4920 Columbia Ave
- 4901 Hunters Point Cir
- 5707 Grandel Blvd
- 5313 Matterhorn Dr
- 6409 Triplett Woods Dr
- 5215 Planet Dr
- 5219 Planet Dr
- 5221 Planet Dr
- 5213 Planet Dr
- 2234 Lower Hunters Trace
- 2232 Lower Hunters Trace
- 2236 Lower Hunters Trace
- 5218 Planet Dr
- 5216 Planet Dr
- 2230 Lower Hunters Trace
- 2238 Lower Hunters Trace
- 5223 Planet Dr
- 5214 Planet Dr
- 5220 Planet Dr
- 5211 Planet Dr
- 2228 Lower Hunters Trace
- 5222 Planet Dr
- 5212 Planet Dr
- 2240 Lower Hunters Trace
- 5225 Planet Dr