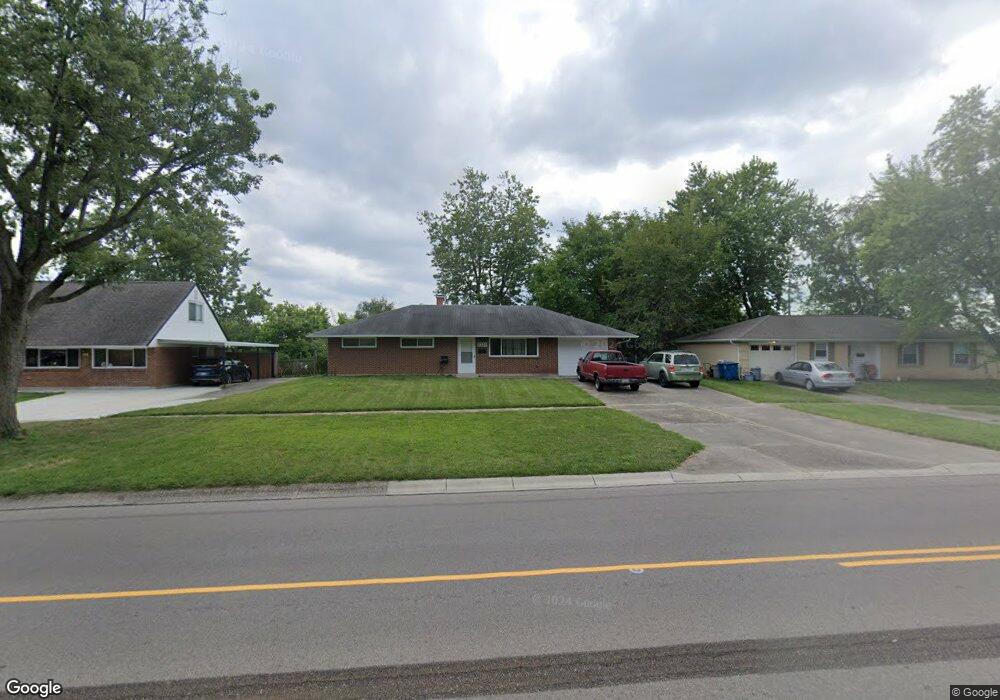
5220 Fishburg Rd Dayton, OH 45424
Estimated Value: $179,000 - $213,000
3
Beds
2
Baths
1,404
Sq Ft
$137/Sq Ft
Est. Value
About This Home
This home is located at 5220 Fishburg Rd, Dayton, OH 45424 and is currently estimated at $192,162, approximately $136 per square foot. 5220 Fishburg Rd is a home located in Montgomery County with nearby schools including Wayne High School and Huber Heights Christian Academy.
Ownership History
Date
Name
Owned For
Owner Type
Purchase Details
Closed on
Mar 6, 2019
Sold by
Community Property Group Troy Ltd
Bought by
Forte Randy Owens
Current Estimated Value
Home Financials for this Owner
Home Financials are based on the most recent Mortgage that was taken out on this home.
Original Mortgage
$64,000
Outstanding Balance
$56,267
Interest Rate
4.4%
Mortgage Type
New Conventional
Estimated Equity
$135,895
Purchase Details
Closed on
Jan 14, 2014
Sold by
Larger Douglas P and Larger Karla R
Bought by
Community Property Group Troy Ltd
Purchase Details
Closed on
Nov 24, 2010
Sold by
Bac Home Loans Servicing Lp
Bought by
The Secretary Of Veterans Affairs
Purchase Details
Closed on
Aug 10, 2010
Sold by
Jackson Larry E
Bought by
Bac Home Loans Servicing Lp and Countrywide Home Loans Servicing Lp
Purchase Details
Closed on
Jan 3, 2010
Sold by
The Secretary Of Veterans Affairs
Bought by
Larger Douglas P
Purchase Details
Closed on
Sep 24, 1996
Sold by
Price Ann
Bought by
Jackson Larry E
Create a Home Valuation Report for This Property
The Home Valuation Report is an in-depth analysis detailing your home's value as well as a comparison with similar homes in the area
Home Values in the Area
Average Home Value in this Area
Purchase History
| Date | Buyer | Sale Price | Title Company |
|---|---|---|---|
| Forte Randy Owens | $80,000 | Partners Land Title Agency | |
| Community Property Group Troy Ltd | -- | None Available | |
| The Secretary Of Veterans Affairs | -- | None Available | |
| Bac Home Loans Servicing Lp | $50,000 | Attorney | |
| Larger Douglas P | $38,000 | Attorney | |
| Jackson Larry E | $67,000 | Midwest Abstract Company |
Source: Public Records
Mortgage History
| Date | Status | Borrower | Loan Amount |
|---|---|---|---|
| Open | Forte Randy Owens | $64,000 |
Source: Public Records
Tax History Compared to Growth
Tax History
| Year | Tax Paid | Tax Assessment Tax Assessment Total Assessment is a certain percentage of the fair market value that is determined by local assessors to be the total taxable value of land and additions on the property. | Land | Improvement |
|---|---|---|---|---|
| 2024 | $2,124 | $41,030 | $10,010 | $31,020 |
| 2023 | $2,124 | $41,030 | $10,010 | $31,020 |
| 2022 | $1,880 | $28,670 | $7,000 | $21,670 |
| 2021 | $1,966 | $29,520 | $7,000 | $22,520 |
| 2020 | $2,019 | $29,520 | $7,000 | $22,520 |
| 2019 | $1,958 | $25,310 | $7,000 | $18,310 |
| 2018 | $1,964 | $25,310 | $7,000 | $18,310 |
| 2017 | $1,953 | $25,310 | $7,000 | $18,310 |
| 2016 | $1,860 | $23,470 | $7,000 | $16,470 |
| 2015 | $1,788 | $23,470 | $7,000 | $16,470 |
| 2014 | $1,788 | $23,470 | $7,000 | $16,470 |
| 2012 | -- | $26,980 | $8,750 | $18,230 |
Source: Public Records
Map
Nearby Homes
- 6100 Farmborough Dr
- 5159 Fishburg Rd
- 5455 Flotron Dr
- 5983 Harshmanville Rd
- 5488 Flotron Dr
- 6109 Ansbury Dr
- 5952 Tibet Dr
- 5004 Fishburg Rd
- 5848 Tomberg St
- 5625 Copley Cir
- 4848 Rittenhouse Dr
- 5893 Tomberg St
- 5248 Tilbury Rd
- 4918 Powell Rd
- 5912 Bavaria Place
- 5630 Botkins Rd
- 5669 Traymore Dr
- 4825 Nelapark Dr
- 5926 Chambersburg Rd
- 5080 Tilbury Rd
- 5226 Fishburg Rd
- 5214 Fishburg Rd
- 5219 Sabra Ave
- 5225 Sabra Ave
- 5213 Sabra Ave
- 5232 Fishburg Rd
- 5204 Fishburg Rd
- 5231 Sabra Ave
- 5219 Fishburg Rd
- 5225 Fishburg Rd
- 5238 Fishburg Rd
- 5196 Fishburg Rd
- 5213 Fishburg Rd
- 5237 Sabra Ave
- 5218 Sabra Ave
- 5224 Sabra Ave
- 5209 Fishburg Rd
- 5212 Sabra Ave
- 5237 Fishburg Rd
- 5188 Fishburg Rd