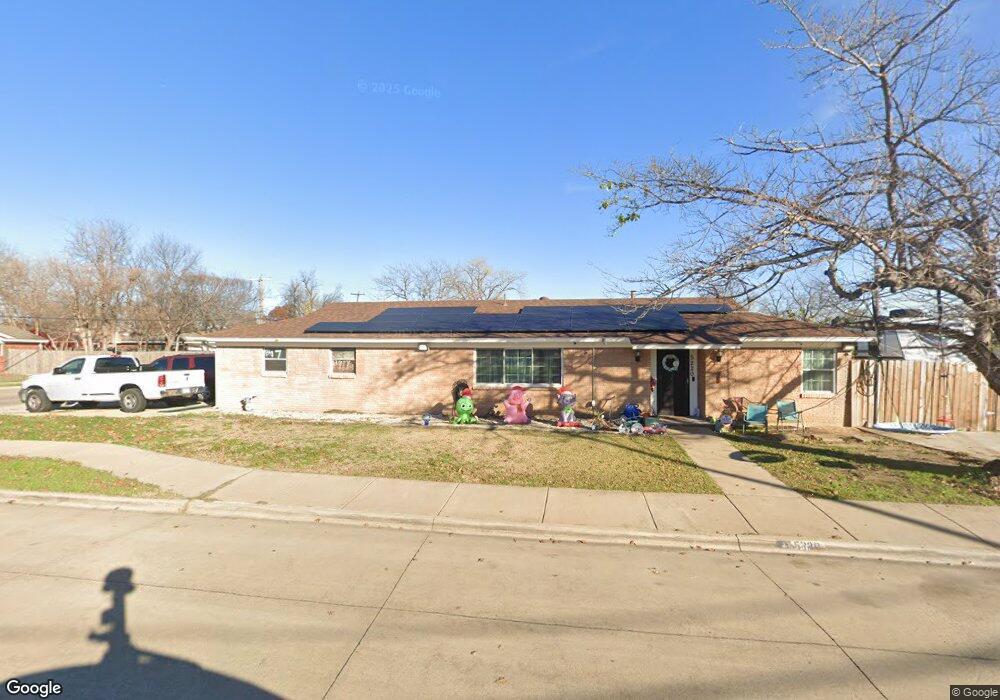
5220 Susan Lee Ln North Richland Hills, TX 76180
Estimated Value: $283,000 - $300,696
3
Beds
2
Baths
1,567
Sq Ft
$186/Sq Ft
Est. Value
About This Home
This home is located at 5220 Susan Lee Ln, North Richland Hills, TX 76180 and is currently estimated at $291,174, approximately $185 per square foot. 5220 Susan Lee Ln is a home located in Tarrant County with nearby schools including Holiday Heights Elementary School, North Richland Middle School, and Richland High School.
Ownership History
Date
Name
Owned For
Owner Type
Purchase Details
Closed on
Jul 23, 2007
Sold by
Durham Kyle and Durham Kelly
Bought by
Ramirez Francisco J
Current Estimated Value
Home Financials for this Owner
Home Financials are based on the most recent Mortgage that was taken out on this home.
Original Mortgage
$109,200
Outstanding Balance
$68,999
Interest Rate
6.71%
Mortgage Type
Purchase Money Mortgage
Estimated Equity
$222,175
Purchase Details
Closed on
Jun 26, 1998
Sold by
Hud
Bought by
Durham Kyle and Durham Kelly
Home Financials for this Owner
Home Financials are based on the most recent Mortgage that was taken out on this home.
Original Mortgage
$74,438
Interest Rate
7.13%
Mortgage Type
FHA
Purchase Details
Closed on
Mar 25, 1998
Sold by
Midfirst Bank
Bought by
Hud
Purchase Details
Closed on
Mar 3, 1998
Sold by
Pinheiro Mario Z
Bought by
Midfirst Bank
Create a Home Valuation Report for This Property
The Home Valuation Report is an in-depth analysis detailing your home's value as well as a comparison with similar homes in the area
Home Values in the Area
Average Home Value in this Area
Purchase History
| Date | Buyer | Sale Price | Title Company |
|---|---|---|---|
| Ramirez Francisco J | -- | Hexter Fair Title Company | |
| Durham Kyle | $75,075 | -- | |
| Hud | -- | -- | |
| Midfirst Bank | $79,616 | -- |
Source: Public Records
Mortgage History
| Date | Status | Borrower | Loan Amount |
|---|---|---|---|
| Open | Ramirez Francisco J | $109,200 | |
| Previous Owner | Durham Kyle | $74,438 |
Source: Public Records
Tax History Compared to Growth
Tax History
| Year | Tax Paid | Tax Assessment Tax Assessment Total Assessment is a certain percentage of the fair market value that is determined by local assessors to be the total taxable value of land and additions on the property. | Land | Improvement |
|---|---|---|---|---|
| 2025 | $4,690 | $298,266 | $50,000 | $248,266 |
| 2024 | $4,690 | $298,266 | $50,000 | $248,266 |
| 2023 | $5,883 | $268,176 | $50,000 | $218,176 |
| 2022 | $5,877 | $244,210 | $35,000 | $209,210 |
| 2021 | $5,491 | $215,780 | $35,000 | $180,780 |
| 2020 | $4,664 | $183,305 | $35,000 | $148,305 |
| 2019 | $4,695 | $178,274 | $35,000 | $143,274 |
| 2018 | $4,340 | $164,815 | $35,000 | $129,815 |
| 2017 | $3,979 | $147,878 | $35,000 | $112,878 |
| 2016 | $3,476 | $129,194 | $20,000 | $109,194 |
| 2015 | $2,463 | $91,700 | $16,000 | $75,700 |
| 2014 | $2,463 | $91,700 | $16,000 | $75,700 |
Source: Public Records
Map
Nearby Homes
- 5320 Topper Dr
- 7717 Janetta Dr
- 7529 Susan Ct
- 7521 Susan Ct
- 7501 Lola Dr
- 5117 Maryanna Way
- 5336 Davis Blvd
- 7409 Jade Cir
- 5024 Maryanna Way
- 5016 Winder Ct
- 4916 Susan Lee Ln
- 7821 Davis Blvd
- 7549 Terry Dr
- 5113 Bob Dr
- 5813 Steeplewood Dr
- 7616 David Ct
- 5304 Colorado Blvd
- 5644 Meadows Way
- 7124 Meadow Park N
- 8020 Laura St