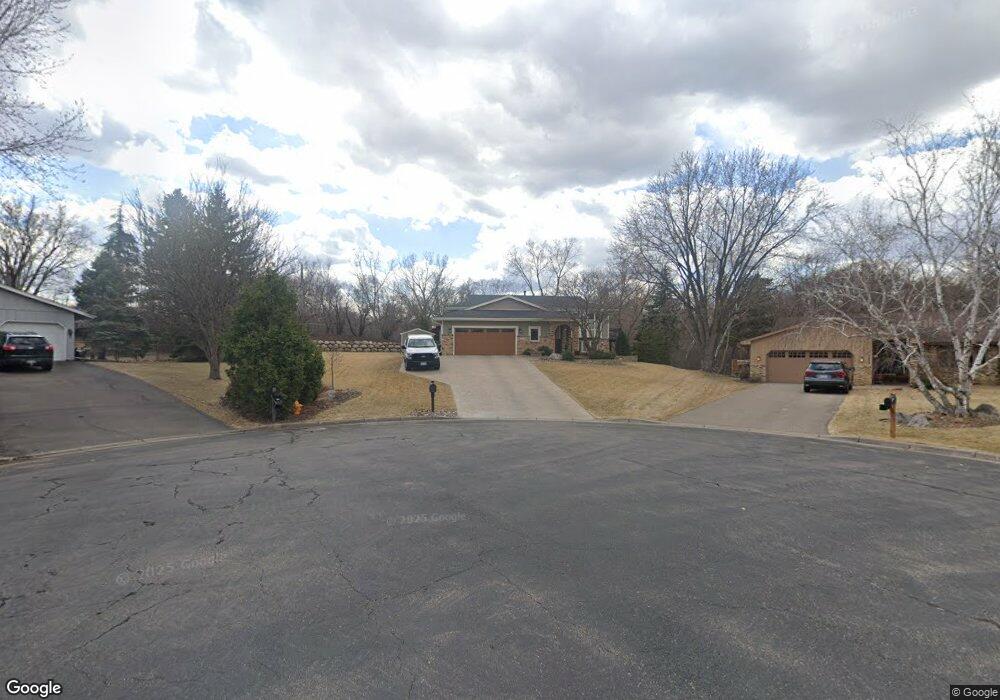
5225 Cottonwood Ln N Plymouth, MN 55442
Estimated Value: $442,000 - $481,209
4
Beds
3
Baths
1,336
Sq Ft
$350/Sq Ft
Est. Value
About This Home
This home is located at 5225 Cottonwood Ln N, Plymouth, MN 55442 and is currently estimated at $467,802, approximately $350 per square foot. 5225 Cottonwood Ln N is a home located in Hennepin County with nearby schools including Oak View Elementary School, Maple Grove Middle School, and Osseo Senior High School.
Ownership History
Date
Name
Owned For
Owner Type
Purchase Details
Closed on
Oct 13, 2011
Sold by
Federal Home Loan Mortgage Corporation
Bought by
Mccarthy Chad A and Mccarthy Mary Bridget
Current Estimated Value
Home Financials for this Owner
Home Financials are based on the most recent Mortgage that was taken out on this home.
Original Mortgage
$199,350
Outstanding Balance
$136,944
Interest Rate
4.25%
Mortgage Type
FHA
Estimated Equity
$330,858
Purchase Details
Closed on
Oct 18, 2010
Sold by
Vang Bee
Bought by
Wells Fargo Bank Na
Purchase Details
Closed on
Feb 24, 2004
Sold by
Nationals Credit Financial Service Corp
Bought by
Vang Bee and Lee Choua
Purchase Details
Closed on
Jul 28, 1999
Sold by
Koho Anne and Koho Hannu
Bought by
Cutts Stanley Z
Purchase Details
Closed on
Apr 30, 1996
Sold by
Simmon Joseph E
Bought by
Henningsen Anne S
Create a Home Valuation Report for This Property
The Home Valuation Report is an in-depth analysis detailing your home's value as well as a comparison with similar homes in the area
Home Values in the Area
Average Home Value in this Area
Purchase History
| Date | Buyer | Sale Price | Title Company |
|---|---|---|---|
| Mccarthy Chad A | -- | Burnet Title | |
| Wells Fargo Bank Na | $201,585 | -- | |
| Vang Bee | $235,000 | -- | |
| Cutts Stanley Z | $185,500 | -- | |
| Henningsen Anne S | $142,000 | -- |
Source: Public Records
Mortgage History
| Date | Status | Borrower | Loan Amount |
|---|---|---|---|
| Open | Mccarthy Chad A | $199,350 |
Source: Public Records
Tax History Compared to Growth
Tax History
| Year | Tax Paid | Tax Assessment Tax Assessment Total Assessment is a certain percentage of the fair market value that is determined by local assessors to be the total taxable value of land and additions on the property. | Land | Improvement |
|---|---|---|---|---|
| 2024 | $4,942 | $422,500 | $105,000 | $317,500 |
| 2023 | $4,916 | $427,800 | $105,000 | $322,800 |
| 2022 | $3,984 | $422,000 | $112,000 | $310,000 |
| 2021 | $3,799 | $343,000 | $98,000 | $245,000 |
| 2020 | $4,002 | $326,000 | $89,000 | $237,000 |
| 2019 | $4,000 | $330,000 | $98,000 | $232,000 |
| 2018 | $3,939 | $316,000 | $92,000 | $224,000 |
| 2017 | $3,531 | $271,000 | $71,000 | $200,000 |
| 2016 | $3,515 | $266,000 | $70,000 | $196,000 |
| 2015 | $3,635 | $266,300 | $70,000 | $196,300 |
| 2014 | -- | $251,100 | $70,000 | $181,100 |
Source: Public Records
Map
Nearby Homes
- 5105 Balsam Ln N
- 11100 52nd Ave N
- 11730 51st Ave N
- 5071 Arrowood Ln N
- 5313 Yorktown Ln N
- 5304 Yorktown Ln N
- 11282 50th Place N
- 5515 Yorktown Ln N
- 11930 50th Ave N
- 4885 Deerwood Ln N
- 10695 53rd Ave N
- 11535 57th Ave N
- 11245 57th Ave N
- 11015 57th Ave N
- 4855 Cottonwood Ln N
- 4835 Yorktown Ln N
- 10955 57th Ave N
- 11725 48th Place N
- 4950 Valley Forge Ln N
- 10840 57th Ave N
- 5235 Cottonwood Ln N
- 5220 Cottonwood Ln N
- 5245 Cottonwood Ln N
- 11515 53rd Ave N
- 5230 Cottonwood Ln N
- 5240 Cottonwood Ln N
- 5240 Cottonwood Ln N Unit 2
- 11330 52nd Ave N
- 5175 Cottonwood Ln N
- 5235 Balsam Ln N
- 11320 52nd Ave N
- 11605 53rd Ave N
- 5225 Balsam Ln N
- 11400 53rd Ave N
- 11345 53rd Ave N
- 11510 53rd Ave N
- 11520 53rd Ave N
- 11310 52nd Ave N
- 5155 Cottonwood Ln N
- 5150 Cottonwood Ln N