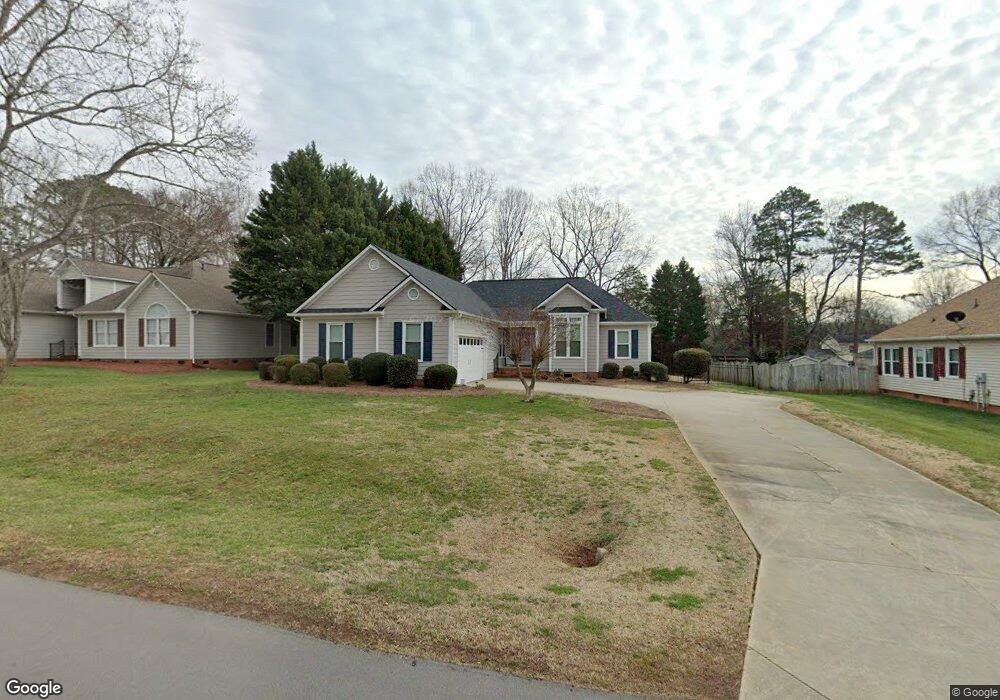
523 Cameron Pointe Ln Belmont, NC 28012
Estimated Value: $363,193 - $413,000
3
Beds
2
Baths
1,567
Sq Ft
$250/Sq Ft
Est. Value
About This Home
This home is located at 523 Cameron Pointe Ln, Belmont, NC 28012 and is currently estimated at $392,298, approximately $250 per square foot. 523 Cameron Pointe Ln is a home located in Gaston County with nearby schools including New Hope Elementary School, Cramerton Middle School, and South Point High School.
Ownership History
Date
Name
Owned For
Owner Type
Purchase Details
Closed on
Jun 12, 2015
Sold by
William H Porter Jr & Wanda M Porter Tru
Bought by
Providence Management & Investments Llc
Current Estimated Value
Home Financials for this Owner
Home Financials are based on the most recent Mortgage that was taken out on this home.
Original Mortgage
$8,836
Outstanding Balance
$6,853
Interest Rate
3.79%
Mortgage Type
Purchase Money Mortgage
Estimated Equity
$385,445
Purchase Details
Closed on
Apr 10, 2008
Sold by
Broome Scottie Stewart and Haney Jill Davenport
Bought by
James Donald Ray and James Janice Floyd
Home Financials for this Owner
Home Financials are based on the most recent Mortgage that was taken out on this home.
Original Mortgage
$160,000
Interest Rate
6.08%
Mortgage Type
Purchase Money Mortgage
Create a Home Valuation Report for This Property
The Home Valuation Report is an in-depth analysis detailing your home's value as well as a comparison with similar homes in the area
Home Values in the Area
Average Home Value in this Area
Purchase History
| Date | Buyer | Sale Price | Title Company |
|---|---|---|---|
| Providence Management & Investments Llc | $72,500 | None Available | |
| Bradley Andrew Laird | $180,000 | None Available | |
| James Donald Ray | $170,000 | None Available |
Source: Public Records
Mortgage History
| Date | Status | Borrower | Loan Amount |
|---|---|---|---|
| Open | Bradley Andrew Laird | $8,836 | |
| Open | Bradley Andrew Laird | $176,739 | |
| Previous Owner | James Donald Ray | $160,000 |
Source: Public Records
Tax History Compared to Growth
Tax History
| Year | Tax Paid | Tax Assessment Tax Assessment Total Assessment is a certain percentage of the fair market value that is determined by local assessors to be the total taxable value of land and additions on the property. | Land | Improvement |
|---|---|---|---|---|
| 2025 | $2,530 | $345,060 | $29,000 | $316,060 |
| 2024 | $2,526 | $345,060 | $29,000 | $316,060 |
| 2023 | $2,460 | $345,060 | $29,000 | $316,060 |
| 2022 | $2,101 | $228,410 | $28,000 | $200,410 |
| 2021 | $2,179 | $228,410 | $28,000 | $200,410 |
| 2019 | $2,022 | $228,410 | $28,000 | $200,410 |
| 2018 | $1,692 | $169,091 | $28,800 | $140,291 |
| 2017 | $51 | $169,091 | $28,800 | $140,291 |
| 2016 | $1,620 | $169,091 | $0 | $0 |
| 2014 | $1,802 | $167,916 | $36,000 | $131,916 |
Source: Public Records
Map
Nearby Homes
- 111 Kelly Ln
- 210 Harrison Ln
- Boyd Plan at Seven Oaks
- Torrence Plan at Seven Oaks
- Stowe Plan at Seven Oaks
- Allison Plan at Seven Oaks
- 1412 Caracara Ct
- 1708 Heron Ct
- Sweetbay II Plan at Redhawk - Walk
- Inlet Plan at Redhawk - Enclave
- 1641 Swallow Tail Dr
- 1612 Swallow Tail Dr
- 1700 Heron Ct
- Hunter Plan at Redhawk - Enclave
- 1639 Swallow Tail Dr
- 1622 Swallow Tail Dr
- 1417 Caracara Ct
- Westbury Basement Plan at Redhawk - Walk
- Durham Basement Plan at Redhawk - Enclave
- Forsyth Basement Plan at Redhawk - Enclave
- 521 Cameron Pointe Ln
- 527 Cameron Pointe Ln
- 515 Cameron Pointe Ln
- 531 Cameron Pointe Ln
- 110 Country Ln
- 110 Country Ln Unit 5
- 108 Country Ln
- 108 Country Ln Unit 4
- 112 Country Ln
- 106 Country Ln
- 535 Cameron Pointe Ln
- 511 Cameron Pointe Ln
- 524 Cameron Pointe Ln
- 526 Cameron Pointe Ln
- 520 Cameron Pointe Ln
- 114 Country Ln
- 530 Cameron Pointe Ln
- 516 Cameron Pointe Ln
- 104 Country Ln
- 537 Cameron Pointe Ln