Estimated Value: $296,000 - $328,000
3
Beds
2
Baths
1,876
Sq Ft
$170/Sq Ft
Est. Value
About This Home
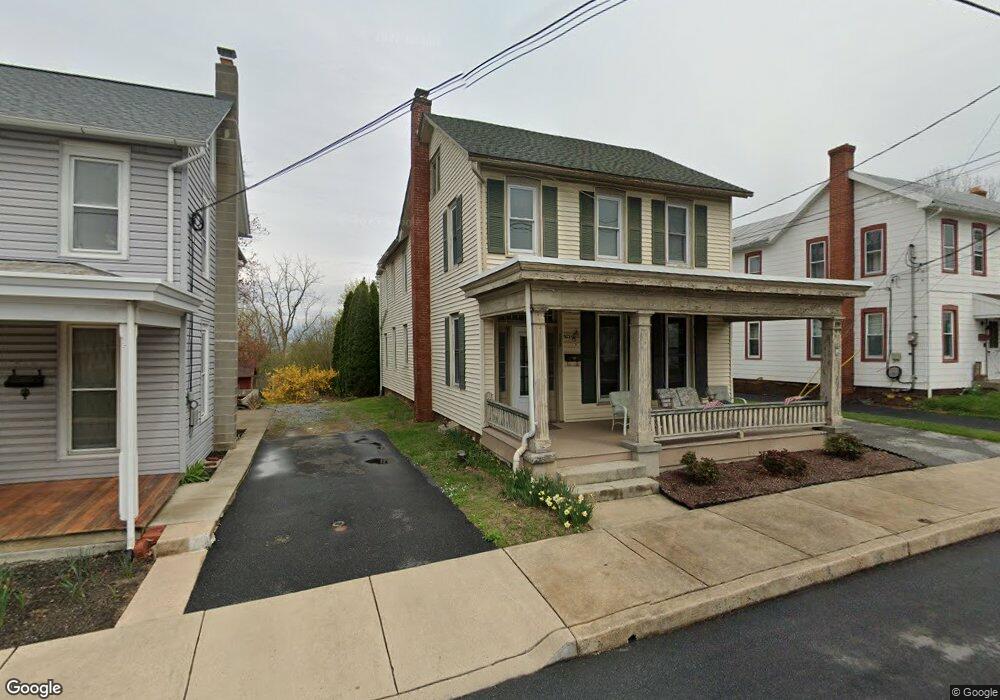
This home is located at 523 Main St, Akron, PA 17501 and is currently estimated at $318,613, approximately $169 per square foot. 523 Main St is a home located in Lancaster County with nearby schools including Akron Elementary School, Ephrata Intermediate School, and Ephrata Senior High School.
Ownership History
Date
Name
Owned For
Owner Type
Purchase Details
Closed on
May 17, 2006
Sold by
Rutt David K and Dale Ralling W
Bought by
Straubel James F and Straubel Martha R
Current Estimated Value
Home Financials for this Owner
Home Financials are based on the most recent Mortgage that was taken out on this home.
Original Mortgage
$98,900
Outstanding Balance
$57,344
Interest Rate
6.42%
Mortgage Type
Fannie Mae Freddie Mac
Estimated Equity
$261,269
Purchase Details
Closed on
Dec 12, 2005
Sold by
Hockenberry Vernon W and Campbell Cheryl M
Bought by
Rutt David K and Dale Railing W
Create a Home Valuation Report for This Property
The Home Valuation Report is an in-depth analysis detailing your home's value as well as a comparison with similar homes in the area
Home Values in the Area
Average Home Value in this Area
Purchase History
| Date | Buyer | Sale Price | Title Company |
|---|---|---|---|
| Straubel James F | $168,900 | First American Title Ins Co | |
| Rutt David K | $118,000 | First American Title Ins Co |
Source: Public Records
Mortgage History
| Date | Status | Borrower | Loan Amount |
|---|---|---|---|
| Open | Straubel James F | $98,900 |
Source: Public Records
Tax History Compared to Growth
Tax History
| Year | Tax Paid | Tax Assessment Tax Assessment Total Assessment is a certain percentage of the fair market value that is determined by local assessors to be the total taxable value of land and additions on the property. | Land | Improvement |
|---|---|---|---|---|
| 2025 | $4,165 | $166,400 | $47,200 | $119,200 |
| 2024 | $4,165 | $166,400 | $47,200 | $119,200 |
| 2023 | $4,017 | $166,400 | $47,200 | $119,200 |
| 2022 | $3,932 | $166,400 | $47,200 | $119,200 |
| 2021 | $3,854 | $166,400 | $47,200 | $119,200 |
| 2020 | $3,854 | $166,400 | $47,200 | $119,200 |
| 2019 | $3,804 | $166,400 | $47,200 | $119,200 |
| 2018 | $4,358 | $166,400 | $47,200 | $119,200 |
| 2017 | $3,361 | $124,800 | $35,200 | $89,600 |
| 2016 | $3,361 | $124,800 | $35,200 | $89,600 |
| 2015 | $809 | $124,800 | $35,200 | $89,600 |
| 2014 | $2,319 | $124,800 | $35,200 | $89,600 |
Source: Public Records
Map
Nearby Homes