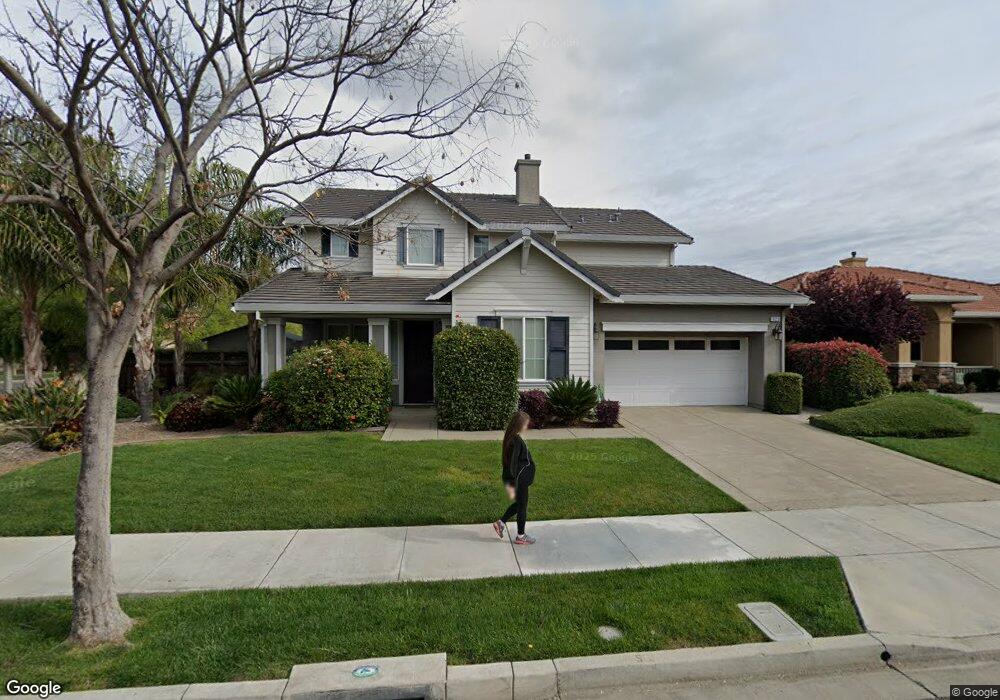
523 Vivian St Brentwood, CA 94513
Brentwood Center NeighborhoodEstimated Value: $820,000 - $871,000
4
Beds
3
Baths
2,509
Sq Ft
$336/Sq Ft
Est. Value
About This Home
This home is located at 523 Vivian St, Brentwood, CA 94513 and is currently estimated at $843,713, approximately $336 per square foot. 523 Vivian St is a home located in Contra Costa County with nearby schools including Mary Casey Black Elementary School, Edna Hill Middle School, and Liberty High School.
Ownership History
Date
Name
Owned For
Owner Type
Purchase Details
Closed on
Jan 15, 2021
Sold by
Fu Yuehong
Bought by
Kang Wei
Current Estimated Value
Purchase Details
Closed on
Jan 13, 2021
Sold by
Kang Wei and Fu Yuehong
Bought by
Kang Wei
Purchase Details
Closed on
Apr 20, 2016
Sold by
Kang Wei and Fu Yuehong
Bought by
The Kang Family Revocable Trust
Home Financials for this Owner
Home Financials are based on the most recent Mortgage that was taken out on this home.
Original Mortgage
$333,000
Outstanding Balance
$146,066
Interest Rate
3.73%
Mortgage Type
New Conventional
Estimated Equity
$697,647
Purchase Details
Closed on
Jul 27, 2015
Sold by
Kang Wei and Fu Yuehong
Bought by
The Kang Family Revocable Trust
Home Financials for this Owner
Home Financials are based on the most recent Mortgage that was taken out on this home.
Original Mortgage
$336,000
Interest Rate
3.85%
Mortgage Type
New Conventional
Purchase Details
Closed on
Jul 13, 2015
Sold by
Pangilinan Edgar
Bought by
Kang Wei and Fu Yuehong
Home Financials for this Owner
Home Financials are based on the most recent Mortgage that was taken out on this home.
Original Mortgage
$336,000
Interest Rate
3.85%
Mortgage Type
New Conventional
Purchase Details
Closed on
Sep 23, 2011
Sold by
Pangilinan Edgar
Bought by
Pangilinan Edgar
Home Financials for this Owner
Home Financials are based on the most recent Mortgage that was taken out on this home.
Original Mortgage
$317,479
Interest Rate
4.09%
Mortgage Type
VA
Purchase Details
Closed on
Jan 15, 2010
Sold by
Pangilinan Jessica
Bought by
Pangilinan Edgar
Home Financials for this Owner
Home Financials are based on the most recent Mortgage that was taken out on this home.
Original Mortgage
$316,665
Interest Rate
4.78%
Mortgage Type
VA
Purchase Details
Closed on
Jan 14, 2010
Sold by
Intelligent Inc
Bought by
Pangilinan Edgar
Home Financials for this Owner
Home Financials are based on the most recent Mortgage that was taken out on this home.
Original Mortgage
$316,665
Interest Rate
4.78%
Mortgage Type
VA
Purchase Details
Closed on
May 5, 2009
Sold by
Agard Alex B and Agard Diane C
Bought by
Intelligent Inc
Purchase Details
Closed on
Feb 2, 2006
Sold by
Signature At Cedarwood Llc
Bought by
Agard Alex B and Agard Diane C
Home Financials for this Owner
Home Financials are based on the most recent Mortgage that was taken out on this home.
Original Mortgage
$544,500
Interest Rate
7.5%
Mortgage Type
Purchase Money Mortgage
Create a Home Valuation Report for This Property
The Home Valuation Report is an in-depth analysis detailing your home's value as well as a comparison with similar homes in the area
Home Values in the Area
Average Home Value in this Area
Purchase History
| Date | Buyer | Sale Price | Title Company |
|---|---|---|---|
| Kang Wei | -- | Chicago Title Company | |
| Kang Wei | -- | Chicago Title Company | |
| The Kang Family Revocable Trust | -- | First American Title Company | |
| Kang Wei | -- | First American Title Company | |
| The Kang Family Revocable Trust | -- | None Available | |
| Kang Wei | $448,000 | Fidelity National Title Co | |
| Pangilinan Edgar | -- | Fidelity National Title Co | |
| Pangilinan Edgar | -- | Lawyers Title | |
| Pangilinan Edgar | $310,000 | Lawyers Title | |
| Intelligent Inc | -- | None Available | |
| Agard Alex B | $636,000 | Old Republic Title Company |
Source: Public Records
Mortgage History
| Date | Status | Borrower | Loan Amount |
|---|---|---|---|
| Open | The Kang Family Revocable Trust | $333,000 | |
| Closed | Kang Wei | $336,000 | |
| Previous Owner | Pangilinan Edgar | $317,479 | |
| Previous Owner | Pangilinan Edgar | $316,665 | |
| Previous Owner | Agard Alex B | $544,500 |
Source: Public Records
Tax History Compared to Growth
Tax History
| Year | Tax Paid | Tax Assessment Tax Assessment Total Assessment is a certain percentage of the fair market value that is determined by local assessors to be the total taxable value of land and additions on the property. | Land | Improvement |
|---|---|---|---|---|
| 2025 | $9,082 | $530,335 | $153,891 | $376,444 |
| 2024 | $8,838 | $519,937 | $150,874 | $369,063 |
| 2023 | $8,838 | $509,743 | $147,916 | $361,827 |
| 2022 | $8,601 | $499,749 | $145,016 | $354,733 |
| 2021 | $8,411 | $489,951 | $142,173 | $347,778 |
| 2019 | $8,387 | $475,420 | $137,957 | $337,463 |
| 2018 | $8,247 | $466,099 | $135,252 | $330,847 |
| 2017 | $8,154 | $456,960 | $132,600 | $324,360 |
| 2016 | $7,780 | $448,000 | $130,000 | $318,000 |
| 2015 | $6,591 | $332,943 | $27,921 | $305,022 |
| 2014 | -- | $326,423 | $27,375 | $299,048 |
Source: Public Records
Map
Nearby Homes
- 504 Vivian St
- 655 Ray St
- 634 Ray Ct
- 752 Jennifer St
- 741 Jennifer St
- 629 Ray Ct
- 714 Jennifer St
- 688 Hamilton Ct
- 877 Boone Dr E
- 278 Sespe Creek Ave
- 876 Boone Dr E
- 94 Pelican St
- 220 Whispering Oaks Ct
- 364 Bridgewater Dr
- 237 Goose Creek Ave
- 0 Oak St
- 212 Brush Creek Dr
- 490 Stratford Ct
- 158 Wooley Creek Way