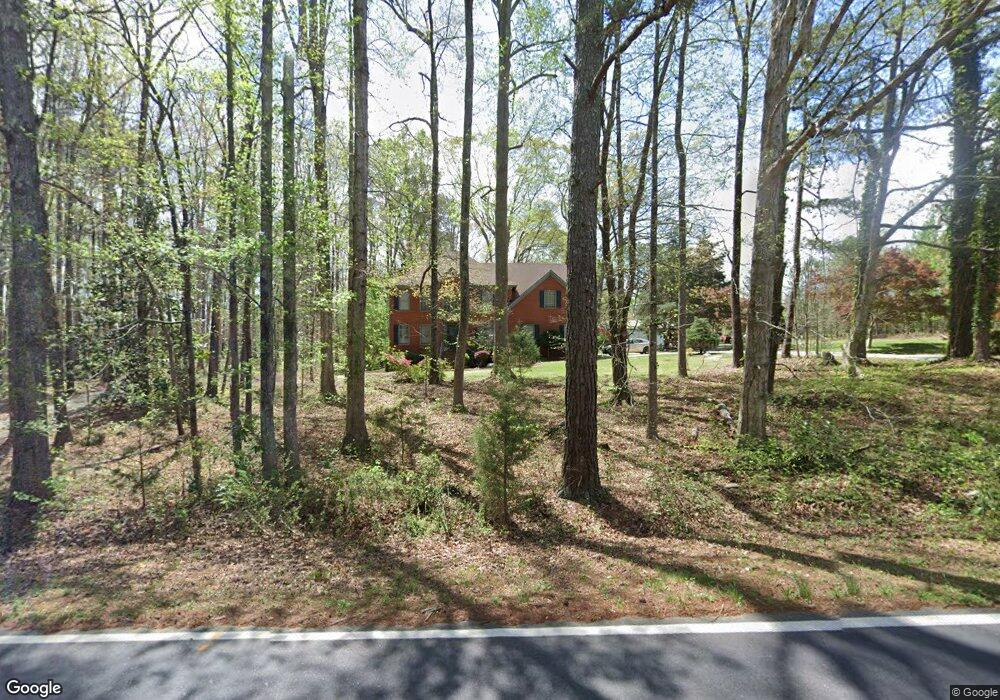
5235 Gaydon Rd Powder Springs, GA 30127
Estimated Value: $453,000 - $597,000
5
Beds
3
Baths
3,400
Sq Ft
$151/Sq Ft
Est. Value
About This Home
This home is located at 5235 Gaydon Rd, Powder Springs, GA 30127 and is currently estimated at $515,010, approximately $151 per square foot. 5235 Gaydon Rd is a home located in Cobb County with nearby schools including Tapp Middle School, McEachern High School, and Grace Baptist Academy.
Ownership History
Date
Name
Owned For
Owner Type
Purchase Details
Closed on
Apr 11, 2025
Sold by
Taylor Margaret C and Taylor James G
Bought by
Taylor Family Trust and Taylor
Current Estimated Value
Purchase Details
Closed on
Jan 29, 2024
Sold by
Stimpson Ranan B
Bought by
Stimpson Ranan B and Stimpson Todd
Purchase Details
Closed on
Jan 22, 2024
Sold by
Crawford Creek Communities Inc
Bought by
Adeshola Adeoluwa Micheal
Purchase Details
Closed on
Jan 19, 2024
Sold by
Rp Homes 1 Llc
Bought by
Griffith Judy
Purchase Details
Closed on
May 30, 2000
Sold by
Ryals Carlton R and Ryals Kim L
Bought by
Taylor Margaret C and Taylor James
Home Financials for this Owner
Home Financials are based on the most recent Mortgage that was taken out on this home.
Original Mortgage
$176,700
Interest Rate
8.11%
Mortgage Type
New Conventional
Create a Home Valuation Report for This Property
The Home Valuation Report is an in-depth analysis detailing your home's value as well as a comparison with similar homes in the area
Home Values in the Area
Average Home Value in this Area
Purchase History
| Date | Buyer | Sale Price | Title Company |
|---|---|---|---|
| Taylor Family Trust | -- | None Listed On Document | |
| Taylor Family Trust | -- | None Listed On Document | |
| Stimpson Ranan B | -- | None Listed On Document | |
| Adeshola Adeoluwa Micheal | $353,000 | None Listed On Document | |
| Griffith Judy | $175,000 | None Listed On Document | |
| Taylor Margaret C | $220,900 | -- |
Source: Public Records
Mortgage History
| Date | Status | Borrower | Loan Amount |
|---|---|---|---|
| Previous Owner | Taylor Margaret C | $176,700 |
Source: Public Records
Tax History Compared to Growth
Tax History
| Year | Tax Paid | Tax Assessment Tax Assessment Total Assessment is a certain percentage of the fair market value that is determined by local assessors to be the total taxable value of land and additions on the property. | Land | Improvement |
|---|---|---|---|---|
| 2025 | $4,500 | $149,340 | $40,000 | $109,340 |
| 2024 | $4,503 | $149,340 | $40,000 | $109,340 |
| 2023 | $4,503 | $149,340 | $40,000 | $109,340 |
| 2022 | $3,822 | $125,936 | $30,000 | $95,936 |
| 2021 | $3,822 | $125,936 | $30,000 | $95,936 |
| 2020 | $3,389 | $111,668 | $22,000 | $89,668 |
| 2019 | $3,389 | $111,668 | $22,000 | $89,668 |
| 2018 | $3,389 | $111,668 | $22,000 | $89,668 |
| 2017 | $2,942 | $102,344 | $16,800 | $85,544 |
| 2016 | $2,306 | $96,744 | $11,200 | $85,544 |
| 2015 | $2,355 | $96,744 | $11,200 | $85,544 |
| 2014 | $2,087 | $84,112 | $0 | $0 |
Source: Public Records
Map
Nearby Homes
- 5290 Oglethorpe Ct
- 5199 Olive Branch Cir
- 5143 Olive Branch Cir
- 2553 Harvest Moon Ct Unit 1
- 4956 Manna Ln
- 2607 Restoration Dr
- 5241 Moon Rd
- 5110 MacLand Rd
- 4821 Overland Dr
- 1355 Paddocks Way
- 2239 Noelle Place
- 2532 Greenes Ln
- 2695 Moon Cabin Dr
- 2223 Noelle Place
- 2307 Magaw Ln
- 3204 Grandiflora Place
- Alexander Plan at Springside Reserve - Farmhouse Series
- 2523 Florence Rd
- 5270 Gaydon Rd
- 0 Restoration Dr Unit 45 7044704
- 0 Restoration Dr Unit 37 7044703
- 0 Restoration Dr Unit 36 7044702
- 0 Restoration Dr Unit 16 7044684
- 0 Restoration Dr Unit 51 7044683
- 0 Restoration Dr
- 0 Restoration Dr Unit 8573775
- 0 Restoration Dr Unit 7626181
- 0 Restoration Dr Unit 8869181
- 0 Restoration Dr Unit 8876193
- 0 Restoration Dr Unit 3013655
- 0 Restoration Dr Unit 3138085
- 0 Restoration Dr Unit 7185062
- 0 Restoration Dr Unit 7352844
- 0 Restoration Dr Unit 7641050
- 0 Restoration Dr Unit 8366099
- 0 Restoration Dr Unit 8582300
- 5240 Gaydon Rd