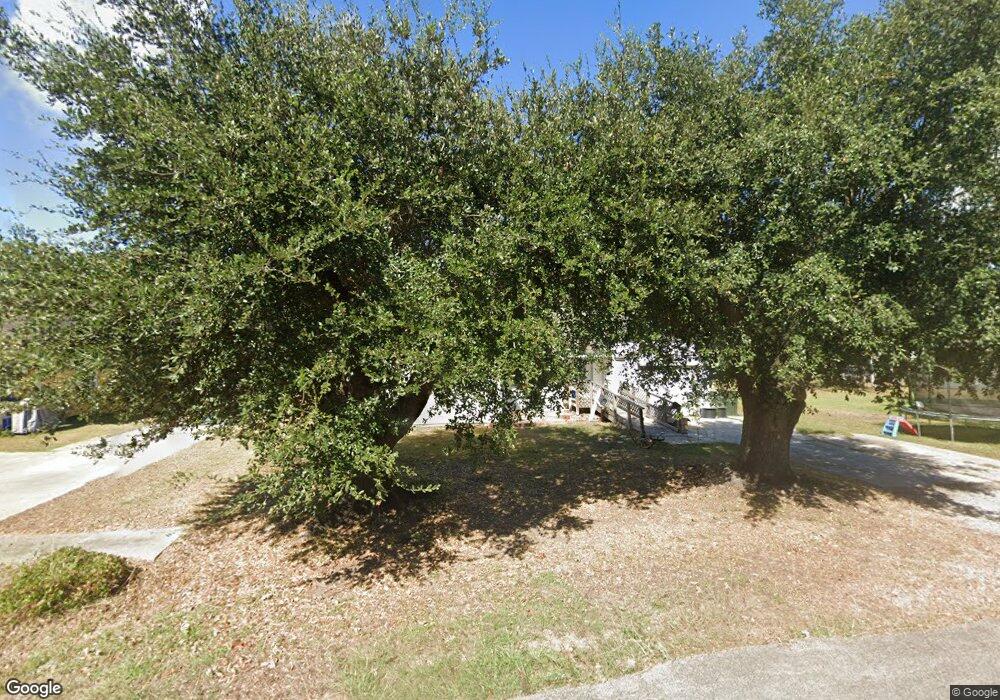
5237 12th St Port Arthur, TX 77642
Estimated Value: $91,379 - $123,000
--
Bed
--
Bath
1,508
Sq Ft
$75/Sq Ft
Est. Value
About This Home
This home is located at 5237 12th St, Port Arthur, TX 77642 and is currently estimated at $113,845, approximately $75 per square foot. 5237 12th St is a home located in Jefferson County with nearby schools including Travis Elementary School, Jefferson Middle School, and Memorial High School.
Ownership History
Date
Name
Owned For
Owner Type
Purchase Details
Closed on
Jun 4, 2021
Sold by
Alvarez Juan and Alvarez Maria
Bought by
Ayala Maura and Ayala Javier
Current Estimated Value
Purchase Details
Closed on
Apr 21, 2006
Sold by
Ayala Maura and Ayala Javier
Bought by
Alvarez Juan and Alvarez Maria
Home Financials for this Owner
Home Financials are based on the most recent Mortgage that was taken out on this home.
Original Mortgage
$48,000
Interest Rate
8%
Mortgage Type
Seller Take Back
Create a Home Valuation Report for This Property
The Home Valuation Report is an in-depth analysis detailing your home's value as well as a comparison with similar homes in the area
Home Values in the Area
Average Home Value in this Area
Purchase History
| Date | Buyer | Sale Price | Title Company |
|---|---|---|---|
| Ayala Maura | -- | None Available | |
| Alvarez Juan | $53,000 | None Available |
Source: Public Records
Mortgage History
| Date | Status | Borrower | Loan Amount |
|---|---|---|---|
| Closed | Alvarez Juan | $48,000 |
Source: Public Records
Tax History Compared to Growth
Tax History
| Year | Tax Paid | Tax Assessment Tax Assessment Total Assessment is a certain percentage of the fair market value that is determined by local assessors to be the total taxable value of land and additions on the property. | Land | Improvement |
|---|---|---|---|---|
| 2025 | $35 | $59,591 | -- | -- |
| 2024 | $35 | $54,174 | -- | -- |
| 2023 | $35 | $49,249 | $0 | $0 |
| 2022 | $1,422 | $44,772 | $0 | $0 |
| 2021 | $1,349 | $60,053 | $3,384 | $56,669 |
| 2020 | $702 | $37,002 | $3,384 | $33,618 |
| 2019 | $1,076 | $37,000 | $3,380 | $33,620 |
| 2018 | $502 | $30,690 | $3,380 | $27,310 |
| 2017 | $481 | $30,690 | $3,380 | $27,310 |
| 2016 | $899 | $30,690 | $3,380 | $27,310 |
| 2015 | $557 | $30,690 | $3,380 | $27,310 |
| 2014 | $557 | $28,590 | $3,380 | $25,210 |
Source: Public Records
Map
Nearby Homes