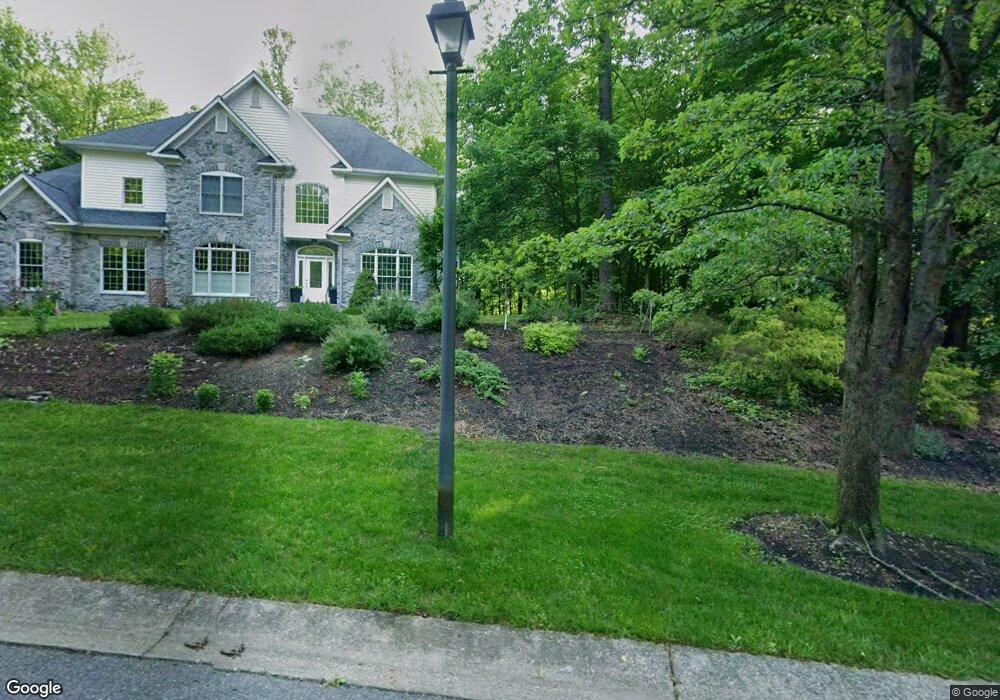
5245 Ferry Branch Ln Lothian, MD 20711
Estimated Value: $894,000 - $1,159,000
5
Beds
4
Baths
3,768
Sq Ft
$270/Sq Ft
Est. Value
About This Home
This home is located at 5245 Ferry Branch Ln, Lothian, MD 20711 and is currently estimated at $1,017,462, approximately $270 per square foot. 5245 Ferry Branch Ln is a home located in Anne Arundel County with nearby schools including Lothian Elementary School, Southern Middle School, and Southern High School.
Ownership History
Date
Name
Owned For
Owner Type
Purchase Details
Closed on
Dec 7, 2020
Sold by
Ilgenfritz Jenny M and Ilgenfritz Milton E
Bought by
Ilgenfritz Jenny M and Ilgenfritz Milton E
Current Estimated Value
Home Financials for this Owner
Home Financials are based on the most recent Mortgage that was taken out on this home.
Original Mortgage
$451,700
Outstanding Balance
$402,865
Interest Rate
2.8%
Mortgage Type
New Conventional
Estimated Equity
$614,597
Purchase Details
Closed on
May 11, 2009
Sold by
Foust David M
Bought by
Andersson Jenny M and Ilgenfirtz Milton E
Home Financials for this Owner
Home Financials are based on the most recent Mortgage that was taken out on this home.
Original Mortgage
$494,500
Interest Rate
4.85%
Mortgage Type
Purchase Money Mortgage
Purchase Details
Closed on
May 19, 2000
Sold by
Jollar Inc
Bought by
Foust David M and Foust Stephanie
Create a Home Valuation Report for This Property
The Home Valuation Report is an in-depth analysis detailing your home's value as well as a comparison with similar homes in the area
Home Values in the Area
Average Home Value in this Area
Purchase History
| Date | Buyer | Sale Price | Title Company |
|---|---|---|---|
| Ilgenfritz Jenny M | -- | Accommodation | |
| Andersson Jenny M | $640,000 | -- | |
| Foust David M | $125,000 | -- |
Source: Public Records
Mortgage History
| Date | Status | Borrower | Loan Amount |
|---|---|---|---|
| Open | Ilgenfritz Jenny M | $451,700 | |
| Closed | Andersson Jenny M | $494,500 | |
| Closed | Foust David M | -- |
Source: Public Records
Tax History Compared to Growth
Tax History
| Year | Tax Paid | Tax Assessment Tax Assessment Total Assessment is a certain percentage of the fair market value that is determined by local assessors to be the total taxable value of land and additions on the property. | Land | Improvement |
|---|---|---|---|---|
| 2025 | $8,801 | $888,667 | -- | -- |
| 2024 | $8,801 | $812,733 | $0 | $0 |
| 2023 | $8,521 | $736,800 | $185,500 | $551,300 |
| 2022 | $7,981 | $717,767 | $0 | $0 |
| 2021 | $15,661 | $698,733 | $0 | $0 |
| 2020 | $7,646 | $679,700 | $185,500 | $494,200 |
| 2019 | $15,101 | $679,700 | $185,500 | $494,200 |
| 2018 | $6,892 | $679,700 | $185,500 | $494,200 |
| 2017 | $7,256 | $689,500 | $0 | $0 |
| 2016 | -- | $669,000 | $0 | $0 |
| 2015 | -- | $648,500 | $0 | $0 |
| 2014 | -- | $628,000 | $0 | $0 |
Source: Public Records
Map
Nearby Homes
- 5248 Ferry Branch Ln
- 5257 Ferry Branch Ln
- 623 Traveller Ct
- 896 Mount Zion Marlboro Rd
- 612 Traveller Ct
- 600 Traveller Ct
- 635 Teton Ct
- 5292 Moreland Rd
- 997 Mount Zion Marlboro Rd
- 674 Teton Dr
- 214 Konrad Morgan Way
- 190 Boones Dr
- 484 Keith Ct
- 460 Sarah Anne Dr
- 263 Konrad Morgan Way
- 1218 Whittington Dr
- 1156 Mount Zion Marlboro Rd
- 1154 Mount Zion Marlboro Rd
- 4440 Claybrooke Dr
- 92 Patuxent Mobile Estates
- 5247 Ferry Branch Ln
- 5243 Ferry Branch Ln
- 5246 Ferry Branch Ln
- 5241 Ferry Branch Ln
- 6350 Trailing Arbutus Ct
- 5255 Ferry Branch Ln
- 5244 Ferry Branch Ln
- 5256 Ferry Branch Ln
- 5242 Ferry Branch Ln
- 700 Marlboro Rd
- 700 Mount Zion Marlboro Rd
- 5240 Ferry Branch Ln
- 6347 Trailing Arbutus Ct
- 786 Mount Zion Marlboro Rd
- 786 Marlboro Rd
- 1003 Mount Zion Marlboro Rd
- 706 Marlboro Rd
- 706 Mount Zion Marlboro Rd
- 794 Marlboro Rd
- 5387 Ed Prout Rd