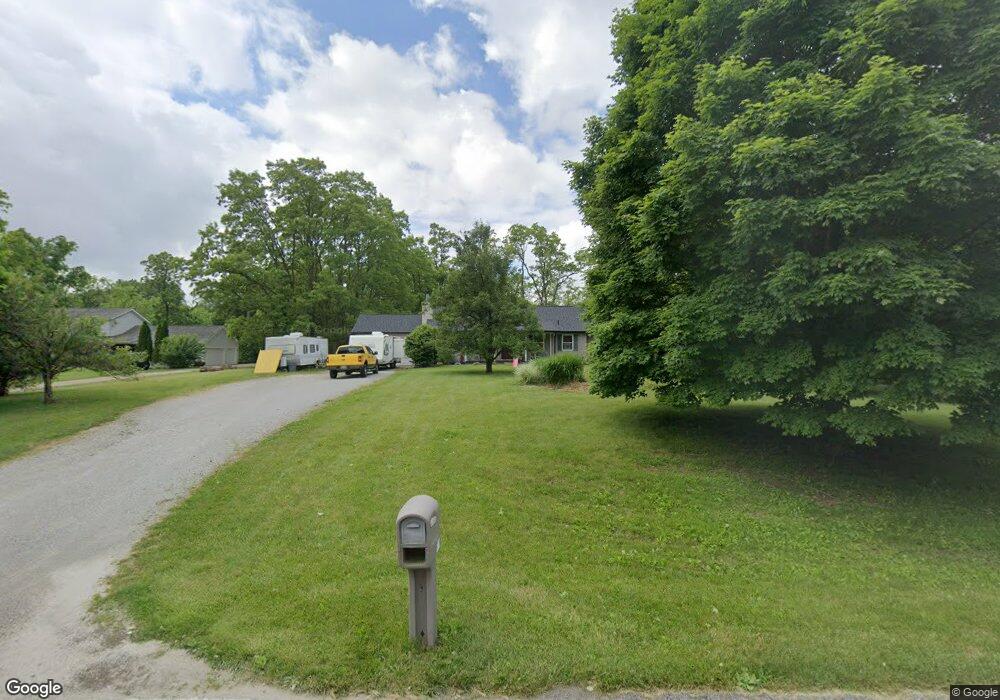
5245 Willow Heights Dr Urbana, OH 43078
Estimated Value: $315,000 - $405,000
3
Beds
4
Baths
1,800
Sq Ft
$195/Sq Ft
Est. Value
About This Home
This home is located at 5245 Willow Heights Dr, Urbana, OH 43078 and is currently estimated at $350,732, approximately $194 per square foot. 5245 Willow Heights Dr is a home located in Champaign County with nearby schools including Graham Elementary School, Graham Middle School, and Graham High School.
Ownership History
Date
Name
Owned For
Owner Type
Purchase Details
Closed on
May 5, 2003
Sold by
Daniels Donna and Daniels Kenneth
Bought by
Masters William J and Masters Elizabeth N
Current Estimated Value
Home Financials for this Owner
Home Financials are based on the most recent Mortgage that was taken out on this home.
Original Mortgage
$163,050
Outstanding Balance
$72,050
Interest Rate
6.02%
Mortgage Type
VA
Estimated Equity
$278,682
Purchase Details
Closed on
Aug 27, 1999
Sold by
Gaier Richard A
Bought by
Daniels Kenneth and Daniels Donna
Home Financials for this Owner
Home Financials are based on the most recent Mortgage that was taken out on this home.
Original Mortgage
$127,205
Interest Rate
7.61%
Mortgage Type
New Conventional
Purchase Details
Closed on
Apr 18, 1995
Sold by
Farmer David L
Bought by
Gaier Richard A and Gaier Carol E
Home Financials for this Owner
Home Financials are based on the most recent Mortgage that was taken out on this home.
Original Mortgage
$113,905
Interest Rate
8.55%
Mortgage Type
New Conventional
Create a Home Valuation Report for This Property
The Home Valuation Report is an in-depth analysis detailing your home's value as well as a comparison with similar homes in the area
Home Values in the Area
Average Home Value in this Area
Purchase History
| Date | Buyer | Sale Price | Title Company |
|---|---|---|---|
| Masters William J | $159,900 | -- | |
| Daniels Kenneth | $133,900 | -- | |
| Gaier Richard A | $119,900 | -- |
Source: Public Records
Mortgage History
| Date | Status | Borrower | Loan Amount |
|---|---|---|---|
| Open | Masters William J | $163,050 | |
| Previous Owner | Daniels Kenneth | $127,205 | |
| Previous Owner | Gaier Richard A | $113,905 |
Source: Public Records
Tax History Compared to Growth
Tax History
| Year | Tax Paid | Tax Assessment Tax Assessment Total Assessment is a certain percentage of the fair market value that is determined by local assessors to be the total taxable value of land and additions on the property. | Land | Improvement |
|---|---|---|---|---|
| 2024 | $2,917 | $84,210 | $12,710 | $71,500 |
| 2023 | $2,917 | $84,210 | $12,710 | $71,500 |
| 2022 | $2,928 | $84,210 | $12,710 | $71,500 |
| 2021 | $2,549 | $69,660 | $10,170 | $59,490 |
| 2020 | $2,511 | $69,660 | $10,170 | $59,490 |
| 2019 | $2,516 | $69,660 | $10,170 | $59,490 |
| 2018 | $2,162 | $58,950 | $7,680 | $51,270 |
| 2017 | $2,174 | $58,950 | $7,680 | $51,270 |
| 2016 | $2,158 | $58,950 | $7,680 | $51,270 |
| 2015 | $2,119 | $56,520 | $7,680 | $48,840 |
| 2014 | $2,141 | $56,520 | $7,680 | $48,840 |
| 2013 | $2,142 | $56,520 | $7,680 | $48,840 |
Source: Public Records
Map
Nearby Homes
- 5770 Storms Creek Rd
- 5886 State Route 55
- 6250 Willowdale Rd
- 0 Old Troy Pike Unit Lot 3 1030490
- 0 Old Troy Pike Unit Lot 3 919119
- 0 Old Troy Pike Unit Lot 3 224006744
- 30 Center St
- 4211 Grey Stone Crossing
- 4100 Troy Rd Unit 12
- 3802 Lawrenceville Dr
- 4328 Pine Tree Place
- 6568 Dialton Rd
- 4970 Troy Rd
- 5646 Springfield-Urbana Pike Unit Lot 88
- 5646 Springfield-Urbana Pike Unit Lot 122
- 5646 Springfield-Urbana Pike Unit Lot 61
- 5646 Springfield-Urbana Pike Unit Lot 127
- 5646 Springfield-Urbana Pike Unit Lot 72
- 5889 Troy Rd
- 538 Woodburn Rd
- 5182 Willow Heights Dr
- 5273 Willow Heights Dr
- 5211 Willow Heights Dr
- 0 Willow Heights Dr Unit Lot 3 1019766
- 0 Willow Heights Dr Unit Lot 3 868134
- 0 Willow Heights Dr
- 5236 Willow Heights Dr
- 5268 Willow Heights Dr
- 5507 Phillips Cir
- 5479 Phillips Cir
- 5539 Phillips Cir
- 5463 Phillips Cir
- 5151 Belden Ln
- 5514 Phillips Cir
- 5566 Phillips Cir
- 5447 Phillips Cir
- 5170 Belden Ln
- 5127 Belden Ln
- 5636 Phillips Cir
- 5688 Phillips Cir