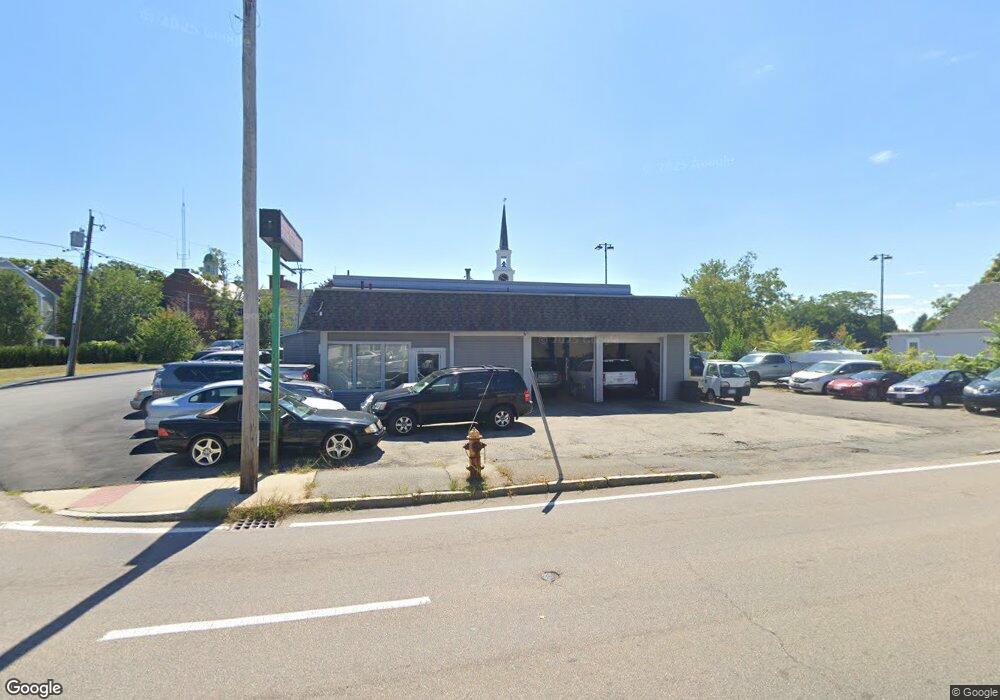
525 Bridge St Weymouth, MA 02191
North Weymouth NeighborhoodEstimated Value: $875,149
--
Bed
--
Bath
2,376
Sq Ft
$368/Sq Ft
Est. Value
About This Home
This home is located at 525 Bridge St, Weymouth, MA 02191 and is currently estimated at $875,149, approximately $368 per square foot. 525 Bridge St is a home located in Norfolk County with nearby schools including Wessagusset Elementary School, Abigail Adams Middle School, and Weymouth Middle School Chapman.
Ownership History
Date
Name
Owned For
Owner Type
Purchase Details
Closed on
Mar 28, 2017
Sold by
Clancy Paul J Est
Bought by
Clancy Mary and Clancy Peter
Current Estimated Value
Purchase Details
Closed on
Oct 11, 2011
Sold by
Campbell Edward L
Bought by
Clancy Paul
Purchase Details
Closed on
Aug 26, 2008
Sold by
Campbell Ft
Bought by
Campbell Edward L
Create a Home Valuation Report for This Property
The Home Valuation Report is an in-depth analysis detailing your home's value as well as a comparison with similar homes in the area
Home Values in the Area
Average Home Value in this Area
Purchase History
| Date | Buyer | Sale Price | Title Company |
|---|---|---|---|
| Clancy Mary | -- | -- | |
| Clancy Paul | $368,000 | -- | |
| Campbell Edward L | -- | -- |
Source: Public Records
Tax History Compared to Growth
Tax History
| Year | Tax Paid | Tax Assessment Tax Assessment Total Assessment is a certain percentage of the fair market value that is determined by local assessors to be the total taxable value of land and additions on the property. | Land | Improvement |
|---|---|---|---|---|
| 2025 | $8,052 | $504,200 | $261,700 | $242,500 |
| 2024 | $7,816 | $480,400 | $249,200 | $231,200 |
| 2023 | $7,550 | $457,600 | $237,300 | $220,300 |
| 2022 | $7,684 | $418,500 | $221,800 | $196,700 |
| 2021 | $7,505 | $408,100 | $215,300 | $192,800 |
| 2020 | $7,538 | $403,100 | $215,300 | $187,800 |
| 2019 | $7,401 | $388,500 | $207,000 | $181,500 |
| 2018 | $7,093 | $360,600 | $187,500 | $173,100 |
| 2017 | $7,050 | $349,000 | $182,000 | $167,000 |
| 2016 | $7,213 | $341,700 | $175,000 | $166,700 |
| 2015 | $7,495 | $337,000 | $175,000 | $162,000 |
| 2014 | $7,222 | $332,800 | $172,300 | $160,500 |
Source: Public Records
Map
Nearby Homes
- 14 Crescent Rd
- 41 Pecksuot Rd
- 6 Grand View Rd
- 137 Wessagussett Rd
- 159 Wessagussett Rd
- 88 Saning Rd
- 65 Saning Rd
- 69 Great Hill Dr
- 59 Katherine St
- 104 Kings Cove Beach Rd
- 320 Green St
- 109 Merryknoll Rd
- 43 Flint Locke Dr
- 79 Bicknell St
- 16 Caldwell St
- 70 Biscayne Ave
- 669 Commercial St
- 2 Winstead Rd
- 20 Richards Rd
- 10 Beals Cove Rd Unit C
- 515 Bridge St
- 528 Bridge St
- 537 Bridge St Unit 2
- 537 Bridge St Unit 3
- 522 Bridge St
- 522 Bridge St Unit 2
- 522 Bridge St Unit 3
- 522 Bridge St Unit 4
- 522 Bridge St Unit 1
- 39 Athens St
- 39 Athens St Unit 4
- 39 Athens St Unit 1
- 39 Athens St Unit 3
- 512 Bridge St
- 516 Bridge St
- 536 Bridge St
- 534 Bridge St Unit 536
- 29 Athens St Unit 1
- 530 Bridge St
- 187 North St