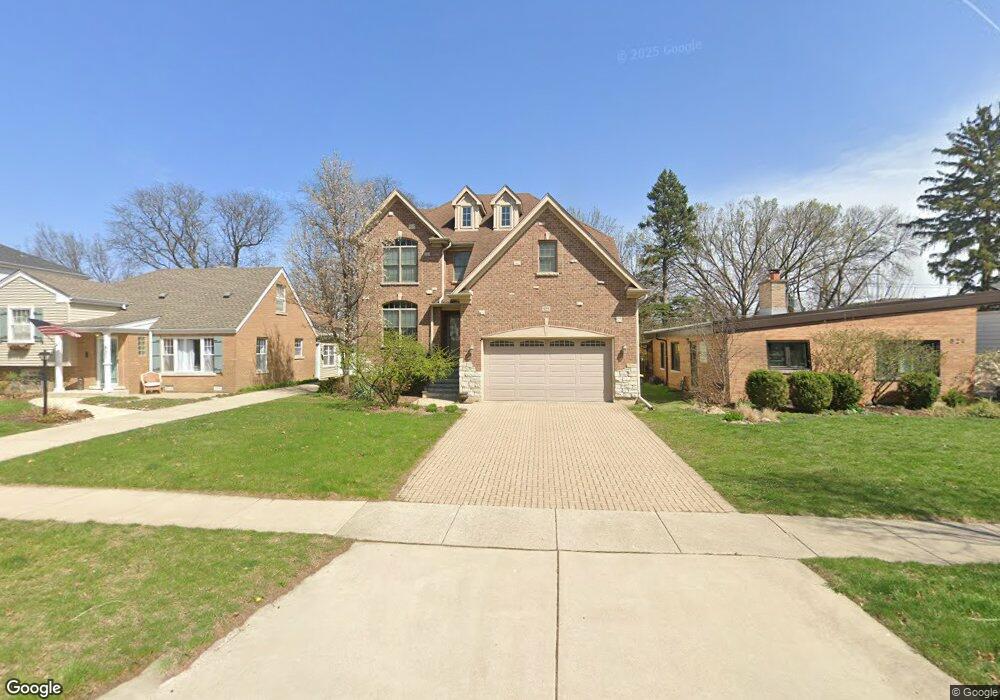
525 S Ashland Ave La Grange, IL 60525
Estimated Value: $1,199,000 - $1,406,945
5
Beds
5
Baths
3,967
Sq Ft
$325/Sq Ft
Est. Value
About This Home
This home is located at 525 S Ashland Ave, La Grange, IL 60525 and is currently estimated at $1,287,486, approximately $324 per square foot. 525 S Ashland Ave is a home located in Cook County with nearby schools including Spring Avenue Elementary School, William F. Gurrie Middle School, and Lyons Township High School.
Ownership History
Date
Name
Owned For
Owner Type
Purchase Details
Closed on
Jul 14, 2017
Sold by
Kenna Kathryn M
Bought by
Rice Jason B and Rice Sarah E
Current Estimated Value
Home Financials for this Owner
Home Financials are based on the most recent Mortgage that was taken out on this home.
Original Mortgage
$620,000
Outstanding Balance
$515,822
Interest Rate
3.94%
Mortgage Type
New Conventional
Estimated Equity
$771,664
Purchase Details
Closed on
Nov 11, 2011
Sold by
Harper Mary Jo Greco and Kenna John J
Bought by
Kenna John J and Kenna Kathryn
Home Financials for this Owner
Home Financials are based on the most recent Mortgage that was taken out on this home.
Original Mortgage
$102,458
Interest Rate
3.37%
Mortgage Type
New Conventional
Purchase Details
Closed on
Jul 9, 2003
Sold by
Western Springs National Bank & Trust
Bought by
Kenna Trust
Purchase Details
Closed on
Jul 1, 2003
Sold by
Hoefferle John C and Hoefferle Magdalene M
Bought by
Western Springs National Bank & Trust and Trust #3111
Purchase Details
Closed on
Jul 9, 2002
Sold by
Hoefferle John C and Hoefferle Magdalene M
Bought by
Hoefferle John C and Hoefferle Magdalene M
Create a Home Valuation Report for This Property
The Home Valuation Report is an in-depth analysis detailing your home's value as well as a comparison with similar homes in the area
Home Values in the Area
Average Home Value in this Area
Purchase History
| Date | Buyer | Sale Price | Title Company |
|---|---|---|---|
| Rice Jason B | $775,000 | None Available | |
| Kenna John J | -- | None Available | |
| Kenna John J | -- | None Available | |
| Kenna Trust | $291,000 | First American Title | |
| Western Springs National Bank & Trust | -- | First American | |
| Hoefferle John C | -- | -- |
Source: Public Records
Mortgage History
| Date | Status | Borrower | Loan Amount |
|---|---|---|---|
| Open | Rice Jason B | $620,000 | |
| Previous Owner | Kenna John J | $102,458 |
Source: Public Records
Tax History Compared to Growth
Tax History
| Year | Tax Paid | Tax Assessment Tax Assessment Total Assessment is a certain percentage of the fair market value that is determined by local assessors to be the total taxable value of land and additions on the property. | Land | Improvement |
|---|---|---|---|---|
| 2024 | $22,582 | $98,784 | $5,996 | $92,788 |
| 2023 | $19,864 | $98,784 | $5,996 | $92,788 |
| 2022 | $19,864 | $74,159 | $5,228 | $68,931 |
| 2021 | $19,091 | $74,157 | $5,227 | $68,930 |
| 2020 | $18,557 | $74,157 | $5,227 | $68,930 |
| 2019 | $19,528 | $77,500 | $4,766 | $72,734 |
| 2018 | $19,283 | $77,500 | $4,766 | $72,734 |
| 2017 | $18,750 | $77,500 | $4,766 | $72,734 |
| 2016 | $19,354 | $73,296 | $4,151 | $69,145 |
| 2015 | $19,042 | $73,296 | $4,151 | $69,145 |
| 2014 | $18,674 | $73,296 | $4,151 | $69,145 |
| 2013 | $16,658 | $67,623 | $4,151 | $63,472 |
Source: Public Records
Map
Nearby Homes
- 524 S Ashland Ave
- 617 S Madison Ave
- 430 S La Grange Rd
- 510 S 6th Ave
- 715 S Catherine Ave
- 413 S Kensington Ave
- 736 S Ashland Ave
- 334 S Ashland Ave
- 600 8th Ave
- 509 S Brainard Ave
- 347 S 8th Ave
- 418 Bluff Ave
- 424 E Maple Ave
- 215 E Elm Ave
- 518 W Cossitt Ave
- 1001 S Brainard Ave
- 17 S Madison Ave
- 500 S Edgewood Ave
- 301 E Plainfield Rd Unit 6
- 4601 Eberly Ave
- 529 S Ashland Ave
- 531 S Ashland Ave
- 517 S Ashland Ave
- 524 S Madison Ave
- 520 S Madison Ave
- 530 S Madison Ave
- 515 S Ashland Ave
- 516 S Madison Ave
- 532 S Madison Ave
- 512 S Madison Ave
- 536 S Madison Ave
- 530 S Ashland Ave
- 520 S Ashland Ave
- 509 S Ashland Ave
- 541 S Ashland Ave
- 532 S Ashland Ave
- 516 S Ashland Ave
- 510 S Madison Ave
- 540 S Madison Ave
- 536 S Ashland Ave