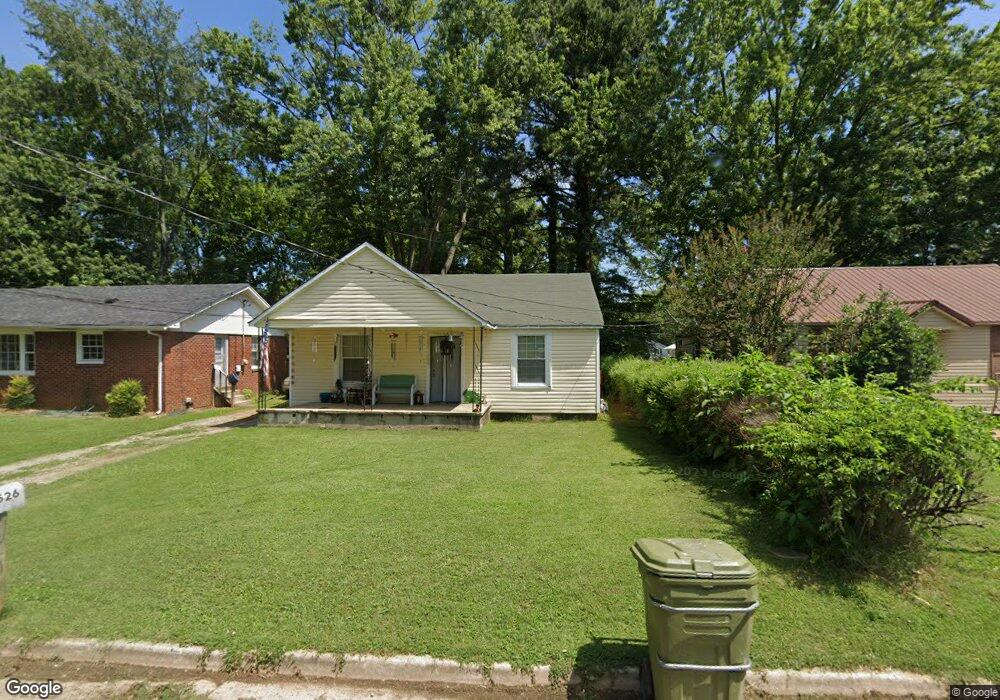
526 2nd St Lawrenceburg, TN 38464
Estimated Value: $75,000 - $173,000
--
Bed
1
Bath
896
Sq Ft
$115/Sq Ft
Est. Value
About This Home
This home is located at 526 2nd St, Lawrenceburg, TN 38464 and is currently estimated at $102,893, approximately $114 per square foot. 526 2nd St is a home located in Lawrence County with nearby schools including Ingram Sowell Elementary School, Lawrenceburg Public Elementary School, and David Crockett Elementary School.
Ownership History
Date
Name
Owned For
Owner Type
Purchase Details
Closed on
Dec 14, 2007
Bought by
Swindle Zeke
Current Estimated Value
Purchase Details
Closed on
Aug 29, 2005
Sold by
Pat Beckenbach Joe
Bought by
Jeannette Ringelstein
Purchase Details
Closed on
May 9, 1995
Sold by
Boston G V G and Boston Christine
Bought by
Faye Fleeman
Purchase Details
Closed on
Sep 12, 1991
Bought by
Beckenbach Barbara Ann and Husband Jo
Purchase Details
Closed on
Oct 6, 1958
Bought by
Bivens Mary Elizabeth
Create a Home Valuation Report for This Property
The Home Valuation Report is an in-depth analysis detailing your home's value as well as a comparison with similar homes in the area
Home Values in the Area
Average Home Value in this Area
Purchase History
| Date | Buyer | Sale Price | Title Company |
|---|---|---|---|
| Swindle Zeke | $24,000 | -- | |
| Jeannette Ringelstein | $10,000 | -- | |
| Faye Fleeman | $80,000 | -- | |
| Beckenbach Barbara Ann | $17,500 | -- | |
| Bivens Mary Elizabeth | -- | -- |
Source: Public Records
Tax History Compared to Growth
Tax History
| Year | Tax Paid | Tax Assessment Tax Assessment Total Assessment is a certain percentage of the fair market value that is determined by local assessors to be the total taxable value of land and additions on the property. | Land | Improvement |
|---|---|---|---|---|
| 2025 | $489 | $15,725 | $0 | $0 |
| 2024 | $489 | $15,725 | $1,500 | $14,225 |
| 2023 | $489 | $15,725 | $1,500 | $14,225 |
| 2022 | $489 | $15,725 | $1,500 | $14,225 |
| 2021 | $395 | $9,000 | $1,500 | $7,500 |
| 2020 | $395 | $9,000 | $1,500 | $7,500 |
| 2019 | $395 | $9,000 | $1,500 | $7,500 |
| 2018 | $395 | $9,000 | $1,500 | $7,500 |
| 2017 | $395 | $9,000 | $1,500 | $7,500 |
| 2016 | $395 | $9,000 | $1,500 | $7,500 |
| 2015 | $375 | $9,000 | $1,500 | $7,500 |
| 2014 | $326 | $7,825 | $1,500 | $6,325 |
Source: Public Records
Map
Nearby Homes