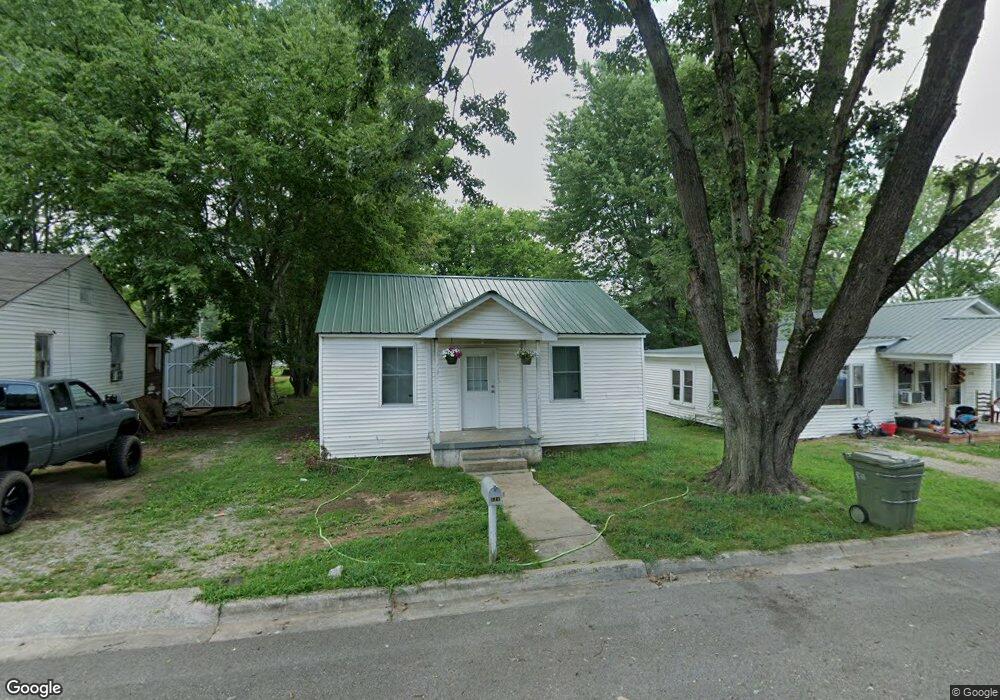
526 3rd St Lawrenceburg, TN 38464
Estimated Value: $78,771 - $143,000
--
Bed
1
Bath
672
Sq Ft
$155/Sq Ft
Est. Value
About This Home
This home is located at 526 3rd St, Lawrenceburg, TN 38464 and is currently estimated at $103,943, approximately $154 per square foot. 526 3rd St is a home located in Lawrence County with nearby schools including Ingram Sowell Elementary School, Lawrenceburg Public Elementary School, and David Crockett Elementary School.
Ownership History
Date
Name
Owned For
Owner Type
Purchase Details
Closed on
May 27, 2022
Sold by
Aranda Jesus M and Aranda Sonia E
Bought by
Mangandi Melida Felipe and Virula Enrique Felipe
Current Estimated Value
Home Financials for this Owner
Home Financials are based on the most recent Mortgage that was taken out on this home.
Original Mortgage
$58,500
Outstanding Balance
$55,498
Interest Rate
5.1%
Mortgage Type
New Conventional
Estimated Equity
$48,445
Purchase Details
Closed on
Mar 18, 2019
Sold by
Whisenant Randy L
Bought by
Aranda Jesus N and Saravia Sonia E
Purchase Details
Closed on
Jan 3, 2011
Sold by
Calvert Malon
Bought by
Whisenant Randy L
Purchase Details
Closed on
Sep 23, 1996
Sold by
Fleeman and Edith
Bought by
Malon Calvert
Purchase Details
Closed on
Jul 18, 1985
Bought by
Fleeman James R and Fleeman John H
Purchase Details
Closed on
Jan 1, 1980
Create a Home Valuation Report for This Property
The Home Valuation Report is an in-depth analysis detailing your home's value as well as a comparison with similar homes in the area
Home Values in the Area
Average Home Value in this Area
Purchase History
| Date | Buyer | Sale Price | Title Company |
|---|---|---|---|
| Mangandi Melida Felipe | $70,000 | Waynesboro Joshua H | |
| Aranda Jesus N | -- | None Available | |
| Whisenant Randy L | $20,500 | -- | |
| Malon Calvert | $14,000 | -- | |
| Fleeman James R | -- | -- | |
| -- | $5,000 | -- |
Source: Public Records
Mortgage History
| Date | Status | Borrower | Loan Amount |
|---|---|---|---|
| Open | Mangandi Melida Felipe | $58,500 |
Source: Public Records
Tax History Compared to Growth
Tax History
| Year | Tax Paid | Tax Assessment Tax Assessment Total Assessment is a certain percentage of the fair market value that is determined by local assessors to be the total taxable value of land and additions on the property. | Land | Improvement |
|---|---|---|---|---|
| 2025 | $441 | $14,200 | $0 | $0 |
| 2024 | $441 | $14,200 | $1,500 | $12,700 |
| 2023 | $441 | $14,200 | $1,500 | $12,700 |
| 2022 | $363 | $11,675 | $1,500 | $10,175 |
| 2021 | $264 | $6,000 | $1,500 | $4,500 |
| 2020 | $264 | $6,000 | $1,500 | $4,500 |
| 2019 | $264 | $6,000 | $1,500 | $4,500 |
| 2018 | $264 | $6,000 | $1,500 | $4,500 |
| 2017 | $264 | $6,000 | $1,500 | $4,500 |
| 2016 | $264 | $6,000 | $1,500 | $4,500 |
| 2015 | $250 | $6,000 | $1,500 | $4,500 |
| 2014 | $220 | $5,275 | $1,500 | $3,775 |
Source: Public Records
Map
Nearby Homes