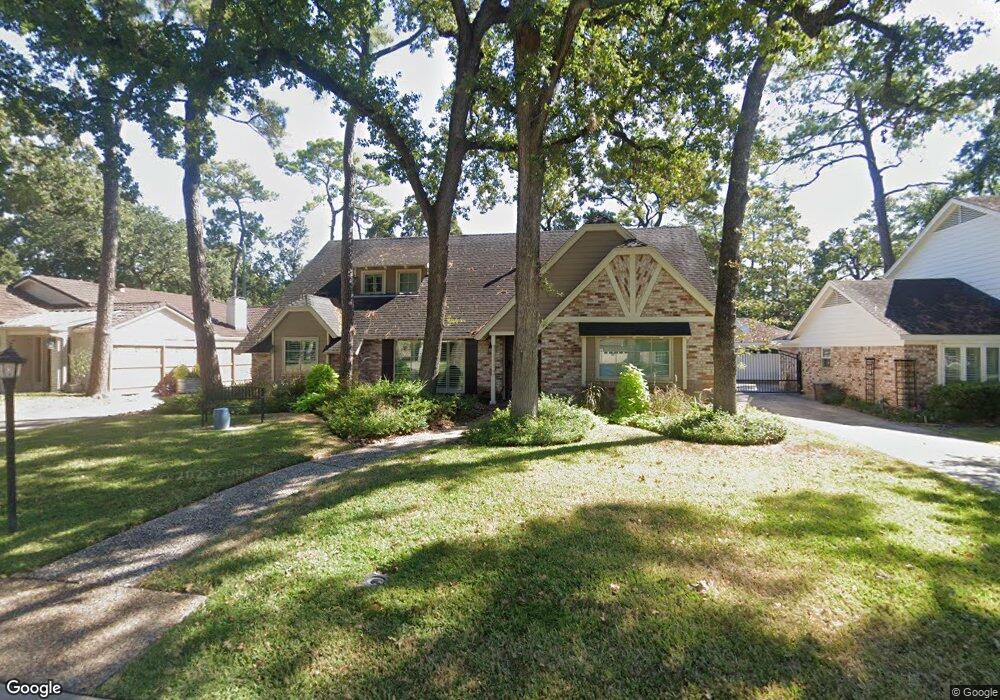
526 Patchester Dr Houston, TX 77079
Memorial NeighborhoodEstimated Value: $928,000 - $1,077,000
5
Beds
4
Baths
2,873
Sq Ft
$342/Sq Ft
Est. Value
About This Home
This home is located at 526 Patchester Dr, Houston, TX 77079 and is currently estimated at $981,615, approximately $341 per square foot. 526 Patchester Dr is a home located in Harris County with nearby schools including Wilchester Elementary School, Memorial Middle, and Stratford High School.
Ownership History
Date
Name
Owned For
Owner Type
Purchase Details
Closed on
Nov 3, 2010
Sold by
Piercy Bradley Carrol
Bought by
Piercy Leann Kathleen and Nugent Leann
Current Estimated Value
Home Financials for this Owner
Home Financials are based on the most recent Mortgage that was taken out on this home.
Original Mortgage
$255,000
Outstanding Balance
$88,347
Interest Rate
4.36%
Mortgage Type
Credit Line Revolving
Estimated Equity
$893,268
Purchase Details
Closed on
Feb 25, 2002
Sold by
Byers Oreta Cooper
Bought by
Nugent Leann and Piercy Bradley C
Home Financials for this Owner
Home Financials are based on the most recent Mortgage that was taken out on this home.
Original Mortgage
$184,000
Interest Rate
6.81%
Purchase Details
Closed on
Nov 1, 1999
Sold by
Byers Oreta C
Bought by
Byers Oreta C
Create a Home Valuation Report for This Property
The Home Valuation Report is an in-depth analysis detailing your home's value as well as a comparison with similar homes in the area
Home Values in the Area
Average Home Value in this Area
Purchase History
| Date | Buyer | Sale Price | Title Company |
|---|---|---|---|
| Piercy Leann Kathleen | -- | None Available | |
| Nugent Leann | -- | Stewart Title Company | |
| Byers Oreta C | -- | -- |
Source: Public Records
Mortgage History
| Date | Status | Borrower | Loan Amount |
|---|---|---|---|
| Open | Piercy Leann Kathleen | $255,000 | |
| Closed | Nugent Leann | $184,000 |
Source: Public Records
Tax History Compared to Growth
Tax History
| Year | Tax Paid | Tax Assessment Tax Assessment Total Assessment is a certain percentage of the fair market value that is determined by local assessors to be the total taxable value of land and additions on the property. | Land | Improvement |
|---|---|---|---|---|
| 2025 | $11,325 | $755,466 | $497,280 | $258,186 |
| 2024 | $11,325 | $703,254 | $497,280 | $205,974 |
| 2023 | $11,325 | $690,702 | $497,280 | $193,422 |
| 2022 | $15,239 | $651,827 | $472,416 | $179,411 |
| 2021 | $15,579 | $638,097 | $455,840 | $182,257 |
| 2020 | $15,789 | $630,147 | $455,840 | $174,307 |
| 2019 | $16,404 | $626,583 | $455,840 | $170,743 |
| 2018 | $6,183 | $631,698 | $455,840 | $175,858 |
| 2017 | $16,526 | $631,698 | $455,840 | $175,858 |
| 2016 | $15,768 | $631,698 | $455,840 | $175,858 |
| 2015 | $10,397 | $602,424 | $455,840 | $146,584 |
| 2014 | $10,397 | $505,234 | $314,944 | $190,290 |
Source: Public Records
Map
Nearby Homes
- 710 Patchester Dr
- 807 Patchester Dr
- 13403 Taylorcrest Rd
- 13931 Kingsride Ln
- 14135 Kimberley Ln
- 14122 Barryknoll Ln
- 807 Wycliffe Dr
- 0 White Wing Ln
- 14123 Misty Meadow Ln
- 14111 Cindywood Cir
- 14125 Cardinal Ln
- 1110 W Tri Oaks Ln Unit 157
- 903 Wycliffe Dr
- 14171 Misty Meadow Ln
- 14103 Carolcrest Cir
- 334 Wycliffe Dr
- 1108 W Tri Oaks Ln Unit 150
- 554 Rancho Bauer Dr
- 14143 Lost Meadow Ln
- 13131 Kimberley Ln
- 522 Patchester Dr
- 602 Patchester Dr
- 13730 Pebblebrook Dr
- 518 Patchester Dr
- 606 Patchester Dr
- 527 Patchester Dr
- 13727 Perthshire Rd
- 523 Patchester Dr
- 603 Patchester Dr
- 519 Patchester Dr
- 514 Patchester Dr
- 610 Patchester Dr
- 13723 Perthshire Rd
- 13727 Pebblebrook Dr
- 607 Patchester Dr
- 13722 Pebblebrook Dr
- 515 Patchester Dr
- 13730 Taylorcrest Rd
- 722 W Forest Dr
- 726 W Forest Dr