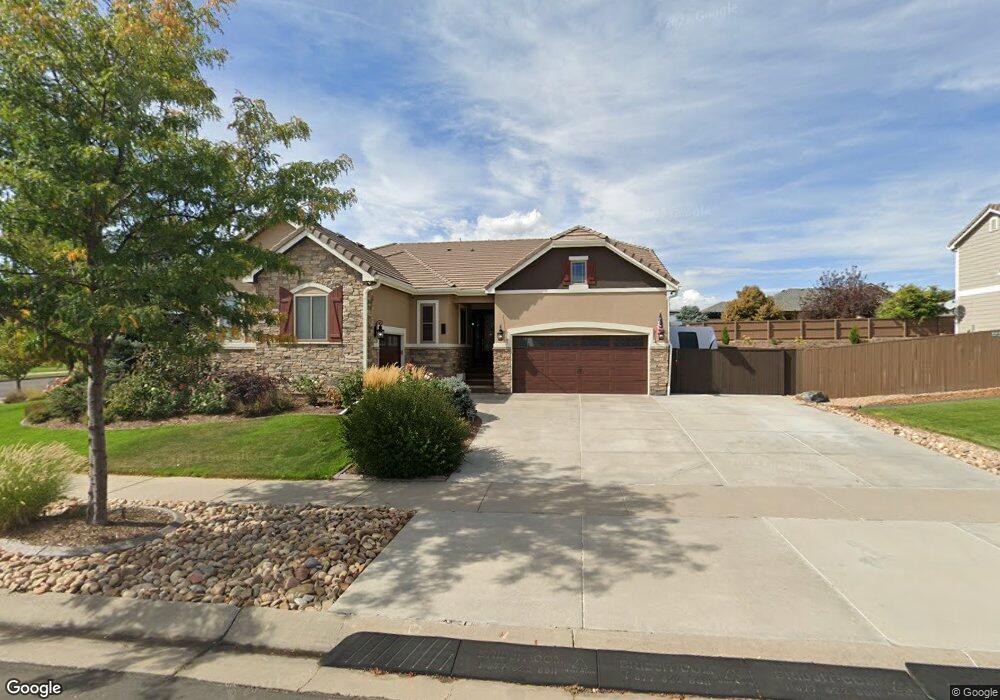
527 N 45th Ave Brighton, CO 80601
Estimated Value: $764,000 - $798,000
7
Beds
4
Baths
4,668
Sq Ft
$169/Sq Ft
Est. Value
About This Home
This home is located at 527 N 45th Ave, Brighton, CO 80601 and is currently estimated at $787,909, approximately $168 per square foot. 527 N 45th Ave is a home located in Adams County with nearby schools including Overland Trail Middle School, Brighton High School, and Bromley East Charter School.
Ownership History
Date
Name
Owned For
Owner Type
Purchase Details
Closed on
Mar 5, 2021
Sold by
Bolyard Ralph and Bolyard Jennifer L
Bought by
Moncivais Mike and Moncivais Linda
Current Estimated Value
Home Financials for this Owner
Home Financials are based on the most recent Mortgage that was taken out on this home.
Original Mortgage
$592,800
Interest Rate
2.9%
Mortgage Type
New Conventional
Purchase Details
Closed on
Nov 19, 2015
Sold by
Robirds Thomas W and Robirds Cristine A
Bought by
Bolyard Ralph and Bolyard Jennifer L
Purchase Details
Closed on
Jun 22, 2012
Sold by
Richmond American Homes Of Colorado Inc
Bought by
Robirds Thomas W and Robirds Cristine A
Home Financials for this Owner
Home Financials are based on the most recent Mortgage that was taken out on this home.
Original Mortgage
$189,950
Interest Rate
3.8%
Mortgage Type
New Conventional
Create a Home Valuation Report for This Property
The Home Valuation Report is an in-depth analysis detailing your home's value as well as a comparison with similar homes in the area
Home Values in the Area
Average Home Value in this Area
Purchase History
| Date | Buyer | Sale Price | Title Company |
|---|---|---|---|
| Moncivais Mike | $741,000 | Land Title Guarantee | |
| Bolyard Ralph | $440,000 | First American Title | |
| Robirds Thomas W | $370,000 | None Available |
Source: Public Records
Mortgage History
| Date | Status | Borrower | Loan Amount |
|---|---|---|---|
| Previous Owner | Moncivais Mike | $592,800 | |
| Previous Owner | Robirds Thomas W | $189,950 |
Source: Public Records
Tax History Compared to Growth
Tax History
| Year | Tax Paid | Tax Assessment Tax Assessment Total Assessment is a certain percentage of the fair market value that is determined by local assessors to be the total taxable value of land and additions on the property. | Land | Improvement |
|---|---|---|---|---|
| 2024 | $8,045 | $47,070 | $7,190 | $39,880 |
| 2023 | $8,037 | $52,290 | $7,780 | $44,510 |
| 2022 | $6,799 | $40,260 | $8,270 | $31,990 |
| 2021 | $6,650 | $40,260 | $8,270 | $31,990 |
| 2020 | $5,757 | $34,980 | $8,510 | $26,470 |
| 2019 | $6,059 | $34,980 | $8,510 | $26,470 |
| 2018 | $6,311 | $33,850 | $6,840 | $27,010 |
| 2017 | $6,316 | $33,850 | $6,840 | $27,010 |
| 2016 | $6,104 | $32,620 | $5,090 | $27,530 |
| 2015 | $6,082 | $32,620 | $5,090 | $27,530 |
| 2014 | -- | $28,610 | $4,620 | $23,990 |
Source: Public Records
Map
Nearby Homes
- 4545 Oxbow Dr
- 4649 Spinning Wheel Dr
- 4645 Longs Peak St
- 608 Hayloft Way
- 445 Tumbleweed Dr
- 427 Silo Ct
- 432 Hedgerow Way
- 4479 Boone Cir
- 4455 Boone Cir
- 4439 Boone Cir
- 4250 Combine Place
- 4776 Kipp Place
- 4751 Ambrose Place
- 256 Homestead Way
- 267 Wooten Ave
- 376 Chardon Ave
- 4609 Thistle Dr
- 535 Meadow Ln
- 4532 Dewey Ln
- 4589 Thistle Dr
- 537 N 45th Ave
- 522 Daylight Ct
- 532 Daylight Ct
- 530 N 45th Ave
- 547 N 45th Ave
- 540 N 45th Ave
- 542 Daylight Ct
- 515 Daylight Ct
- 525 Grain Ct
- 525 Daylight Ct
- 557 N 45th Ave
- 550 N 45th Ave
- 535 Grain Ct
- 552 Daylight Ct
- 535 Daylight Ct
- 518 Horseshoe Place
- 560 N 45th Ave
- 545 Grain Ct
- 528 Horseshoe Place
- 545 Daylight Ct